OpenAI publishes country-level ChatGPT usage data: nearly half of work messages ask AI to get things done
- OpenAI has opened up its data on how different countries use ChatGPT: rankings for 144 countries, growth curves by continent, and share shifts by age group. The CSV files are directly downloadable.
- In work contexts, 45% of messages ask AI to produce or execute something. Outside work, that number drops to 22%.
- Several key figures only appear in the charts — the report's text never mentions them.
OpenAI Publishes Country-Level ChatGPT Usage Data for the First Time
OpenAI released a data report yesterday that breaks down how people around the world actually use ChatGPT, country by country — the first time it's done so. Previously it only published global totals; now it's laid out over a hundred countries, and the CSV files are ready to download.
For anyone wondering how far AI has actually penetrated, this is the only official dataset you can slice by country right now. The headline finding boils down to one line: people are shifting from "asking AI" to "delegating to AI."
The data comes from OpenAI's economic research team and lives on a platform called OpenAI Signals, where the methodology PDF is also public.
This dataset only covers messages sent from personal accounts at the Free, Go, Plus, and Pro tiers. Business and organization accounts are completely excluded.
So every number below speaks to "how individuals use it." Even when "work context" appears, it refers to messages sent from personal accounts that were classified as work-related — not how company-purchased ChatGPT is used. Without flagging this upfront, every figure that follows would be misread.
In work contexts, nearly half of messages ask AI to get things done
OpenAI sorts all messages into three categories:
Set work and non-work contexts side by side, and the gap jumps out:
Here's the original chart OpenAI provided, with the three colors mapping to the categories above:

The flip side:in non-work contexts, Asking remains the largest category at 45%. After hours, people are still exploring and querying more than they're delegating.
One easily missed detail: "non-work" is a broad bucket. The dataset actually splits things into work, study, and other — but on this chart, the report only uses the work / non-work binary, so students using ChatGPT for homework are counted on the non-work side.
Regions that started late are growing fastest — Africa up 24× in three years
One chart plots curves by continent, with the Y-axis showing how many times weekly active users have multiplied relative to July 2023, running through June 2026.

A higher multiple doesn't mean more usage. North America's lowest multiplier (~9.3×) is precisely because it started with the largest base — ChatGPT's home turf. Africa's 20+ fold growth reflects a near-zero starting point.
This chart shows the gap narrowing, not the rankings reversing.
Peru rose 17 spots in one quarter; Italy fell 11
OpenAI also ranked 144 countries by "per-capita message volume," then charted who rose and who fell over the quarter. Blue means a ranking gain, brown a drop, and gray hatching means no operations or insufficient data.
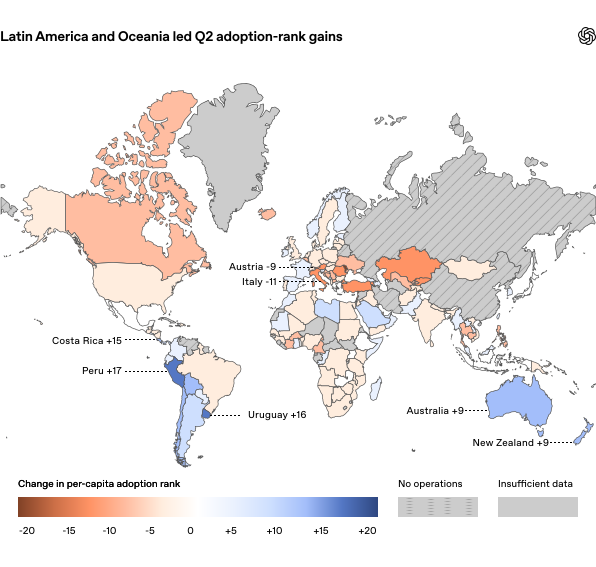
These two only appear in the map's labels — the report's text never mentions them. The text says "Latin America, Oceania, and Africa grew faster than the rest of the world, and adoption in North America and Europe continued to rise," which matches the patch of brown across Europe on the map.
The report offers no explanation for Italy and Austria's ranking drops, and this site couldn't find one either. Rankings are relative — if others grow faster, you get pushed down.
People making images and videos with AI nearly quadrupled in two years
Trace the share of each use case from August 2024 to June 2026, and the fastest riser is multimedia — generating, analyzing, and retrieving images and video.

The same chart shows one line heading down: self-expression has slipped from ~13.5% to ~9%. Writing is also slowly declining, from ~26% to ~22.5%.
What's Actually Inside These Six Categories
The category names on the chart are vague. "Practical guidance" taking up a third of messages isn't self-explanatory. The methodology document breaks down which fine-grained labels roll up into each category:
Writing code lands under "technical help," not "writing." So the "writing at 22.5%" figure has nothing to do with programmers — it covers editing text, translating, fiction. Programming sits lumped in with math and data analysis.
Multimedia also shows a clear spike in April 2025, hitting ~9.5% before settling back near 7% and only later climbing to 7.8%. The report offers no explanation for that spike, and this site won't speculate either.
Latin America leads; one in ten Brazilian messages is multimedia
Break multimedia down by country, and the regional pattern is obvious:
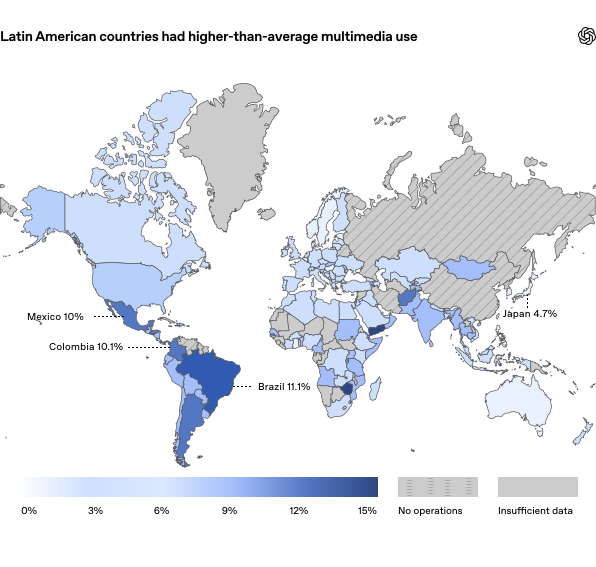
Both Brazil and Colombia cross the "one in ten messages is multimedia" line, with Mexico landing right at 10%.
People over 35 are catching up to younger users
Start with the global picture. Two lines track each age group's share of messages:

The 18–34 share peaked around 75.5% in late 2024, then drifted down to roughly 66.5%. The 35+ group moved in the mirror direction, climbing from a low of about 24.8% to around 34%. The gap is closing.
The report collapses age into two buckets, but the underlying data actually uses six: 18–24, 25–34, 35–44, 45–54, 55–64, and 65+. The "35+" line on the chart is the sum of the last four buckets — downloading the CSV reveals the finer distribution.
By country: Czechia up 12.6 percentage points in a year
The last chart plots the change in the 35+ share for 111 countries, using Q2 2025 as the baseline.

Units are percentage points. Outside the median and the labeled countries, the remaining 100+ lines are gray and unlabeled on the chart.
Going from 30% to 35% is a gain of "5 percentage points." Saying "up 5%" would only take you to 31.5%. The report text says the 35+ share was "5% higher," while the chart labels the median as "+5.1 percentage points" — a meaningful difference. This site follows the chart's percentage-point framing.
The chart title is also more specific than the text: the title says "over 90% of countries," while the text only says "almost every country."
Regional differences are visible on the chart too: roughly three-quarters of European countries gained more than the average. Southeast Asia runs the other way — six of eight countries are up, but only modestly; Singapore sits at just 1.2 percentage points.
This dataset only counts personal accounts — it says nothing about enterprise usage
Before drawing conclusions from these numbers, a few caveats need to be on the table. They're not in the report itself; they're in the accompanying methodology document.
The methodology document includes this line: the dataset excludes enterprise message classifications, so it likely undercounts commercial usage.
The "45% doing in work contexts" figure measures how individuals use their own accounts at work. The company-purchased side is entirely invisible here — and per OpenAI, real business usage is higher than what's shown.
Four More Details That Affect How You Read the Numbers
Every series comes from the same 300K-message monthly sample. Cut it finer and fewer messages land in each cell, inflating variance. The document explicitly flags granular cuts like "share of a specific topic in a specific state."
By that logic, big-picture numbers like the global 7.8% are the most stable; single-country, single-category figures like Brazil's 11.1% or Japan's 4.7% should be taken loosely, not compared at the decimal level.
Figures marked "approx." in this article were read from high-resolution charts where the report provided no data table.
Things in the Dataset the Report Didn't Use
The report only uses part of the data. The full package of 25 CSV files includes dimensions that never made it into a chart:
Back to what this data is actually worth. Any single number in isolation is of limited value. What matters is that "how far has AI penetrated" can now be answered by country for the first time: previously there was only one global total; now you can see Peru climb 17 spots in a quarter, one in ten Brazilian messages generating images, Czechia's middle-aged users up 12.6 percentage points in a year. Three threads run through it all: AI is already doing the work, late-starting regions are catching up fast, and the users are no longer just young people.
OpenAI Breaks Down Country Data for the First Time: In Work, Nearly Half of Messages Ask AI to Get Things Done
OpenAI's economic research team lays out usage data for 144 countries at once. Three threads, with charts.
↓ read the whole page · one animated chart inside
OpenAI used to publish only global totals. This time it broke usage down across over a hundred countries, with downloadable CSVs and a public methodology document. The data comes from OpenAI's own economic research team, hosted on a platform called OpenAI Signals.
OpenAI sorts messages into three kinds: doing (asking AI to produce or execute), asking (looking up information), and expressing (self-expression). At work and after hours, the mix looks completely different:
Plot three-year weekly active user growth multipliers by continent: the places that started with the least usage grew the most.
Within a single quarter, per-capita message rankings also moved sharply: Peru climbed 17 spots, Uruguay 16; Italy dropped 11 and Austria 9. OpenAI's report never mentions those two declines — they only exist on the map.
Run a two-year trend across use-case shares and the fastest riser is multimedia — generating, analyzing, retrieving images and video:
~2%
7.8%
That's nearly a fourfold increase, but it still ranks fourth in absolute share, behind practical guidance (~31%–33%), writing (~22.5%), and finding information (~18.5%). Regionally, Latin America is the hotspot:
Globally, the 18–34 share has been sliding from its late-2024 peak while the 35+ group climbs. Country by country, over one year:
9.3×
- × Italy −11
- × Austria −9
Members can copy or download the full Markdown, and let their AI subscribe and ask.
Found this useful? Leave your email — every new explainer, the moment it's out. Unsubscribe anytime.