How to Use Decision Models for Automated AI Quality Assurance: 6 Models Tested
Why does a default 0.5 threshold cause missed detections? Real apartment-leasing agent traces explain alarm thresholds, model selection, and probability calibration.
How can Decision Models be used as automated AI evaluation tools (Evals)?
When evaluating the performance of an AI system (such as customer service conversations or workflows), a common approach is to use a costly large language model as a judge (LLM Judge) to score it. In contrast, Decision Models and related classification interfaces (such as TypeSafe Jev, Perplexity Decider, Liquid d1, Cloudflare Clef, OpenAI Decisions API, etc.) focus the task on classification and judgment, directly outputting a probability score for whether an error occurred, promising to complete such evaluations at lower cost and faster speed.
What Problems and Industry Pain Points They Address
-
LLM judges are costly and slow
Using large language models such as GPT or Claude to inspect customer support conversations and workflows trace by trace leads to compounding API costs and latency as evaluation volume grows. Decision models focus on compressing inference costs and latency for these judgment tasks, lowering the barrier to large-scale automated testing.
-
Blindly using the default threshold (0.50) wastes model performance
Relying directly on the default 0.50 score as the threshold separating passes from failures can miss a large number of errors. If a model assigns a score of 0.40 to all failed samples and 0.10 to all passing samples, a 0.50 cutoff will miss every single error; tuning the threshold to 0.30 completely separates the two classes. Often, without switching models, simply tuning the threshold to match actual business needs can dramatically improve evaluation outcomes.
-
Model-predicted probabilities can be "unreliable"
A model outputting a "0.80 probability of failure" does not mean there is an 80% chance of failure in the real world. Whether that number is reliable must be validated against empirical results; it cannot be treated as a calibrated confidence measure without verification.
What Are Decision Models
Suppose a system performs automated quality assurance on customer service conversations: the program inputs the full conversation log into the model along with an explicit question, "Did the assistant fail to transfer to a human agent as required?" Decision models and dedicated judgment interfaces narrow the task to predefined questions, directly returning structured results ready for programmatic use: a probability score that the condition holds, a category chosen from given options, or a score based on established criteria. The program then processes this according to business rules: for example, if the score reaches an alert threshold, the conversation is routed into a human review queue. The model is responsible for the judgment; the program is responsible for deciding the next action.
This is the logic of decision models acting as Evals judges: essentially, they are classification, selection, and scoring components embedded in code. Although underlying implementations differ across products—for instance, Jev is a model purpose-built for structured decisions, whereas OpenAI Decisions is a judgment interface for GPT-6 Luna—they all enable programs to directly drive business logic using judgment results.
Starting from 98 Production Traces of an Apartment-Leasing Agent
To evaluate how decision models perform in real-world scenarios, machine learning evaluation experts Hamel Husain and Antaripa Saha examined logs from a deployed apartment-leasing AI customer support assistant.
This agent handles tenant inquiries over phone and messaging, including scheduling tours, confirming cancellations, and transferring to human representatives. The evaluation task is a binary classification: determining whether a conversation trace contains a substantive failure in the AI assistant's behavior or tool use.
The evaluation dataset comprised 100 records in total; after excluding 2 internal QA samples, 98 traces were formally evaluated. The raw conversations are proprietary. During evaluation, models were provided with complete traces stripped of human labels and review notes:
- 61 traces with known failures (labeled 1): Consisting of 39 failures confirmed by original human reviews, plus 22 failures identified through screening with Braintrust and Arize and subsequently verified by human review. The evaluation rubric defined substantive failures to include booking failures, failure to transfer to a human when required, claiming tool completion when a tool failed, violating system instructions, or exposing internal placeholders to the customer.
- 37 traces without a labeled failure (labeled 0): Not flagged as containing substantive failures in this benchmark, though this does not imply the traces were entirely flawless.
The benchmark covered 6 decision model options: Jev 1.13, Perplexity Decider 1.1 (27B), Liquid d1, Liquid d1-ultra, Cloudflare Clef Flash, and OpenAI Decisions using GPT-6 Luna. Perplexity, Liquid, Clef, and OpenAI received identical text prompts and serialized inputs; Jev received equivalent criteria through its structured API. Each model output a score between 0 and 1 representing failure likelihood for every trace.
Why a Default 0.50 Threshold Blinds Evals
APIs conventionally assume that if a score is ≥ 0.50, the trace is classified as a "failure" and an alarm is triggered; otherwise, it passes. However, scoring scales vary drastically across different models.
Suppose a model assigns a score of 0.40 to all true failure traces and 0.10 to all normal traces. In this hypothetical scenario, placing the cutoff at 0.30 perfectly separates both classes. Yet, if evaluated with the default 0.50 threshold, it labels every failure as normal, dropping the detection rate to 0.
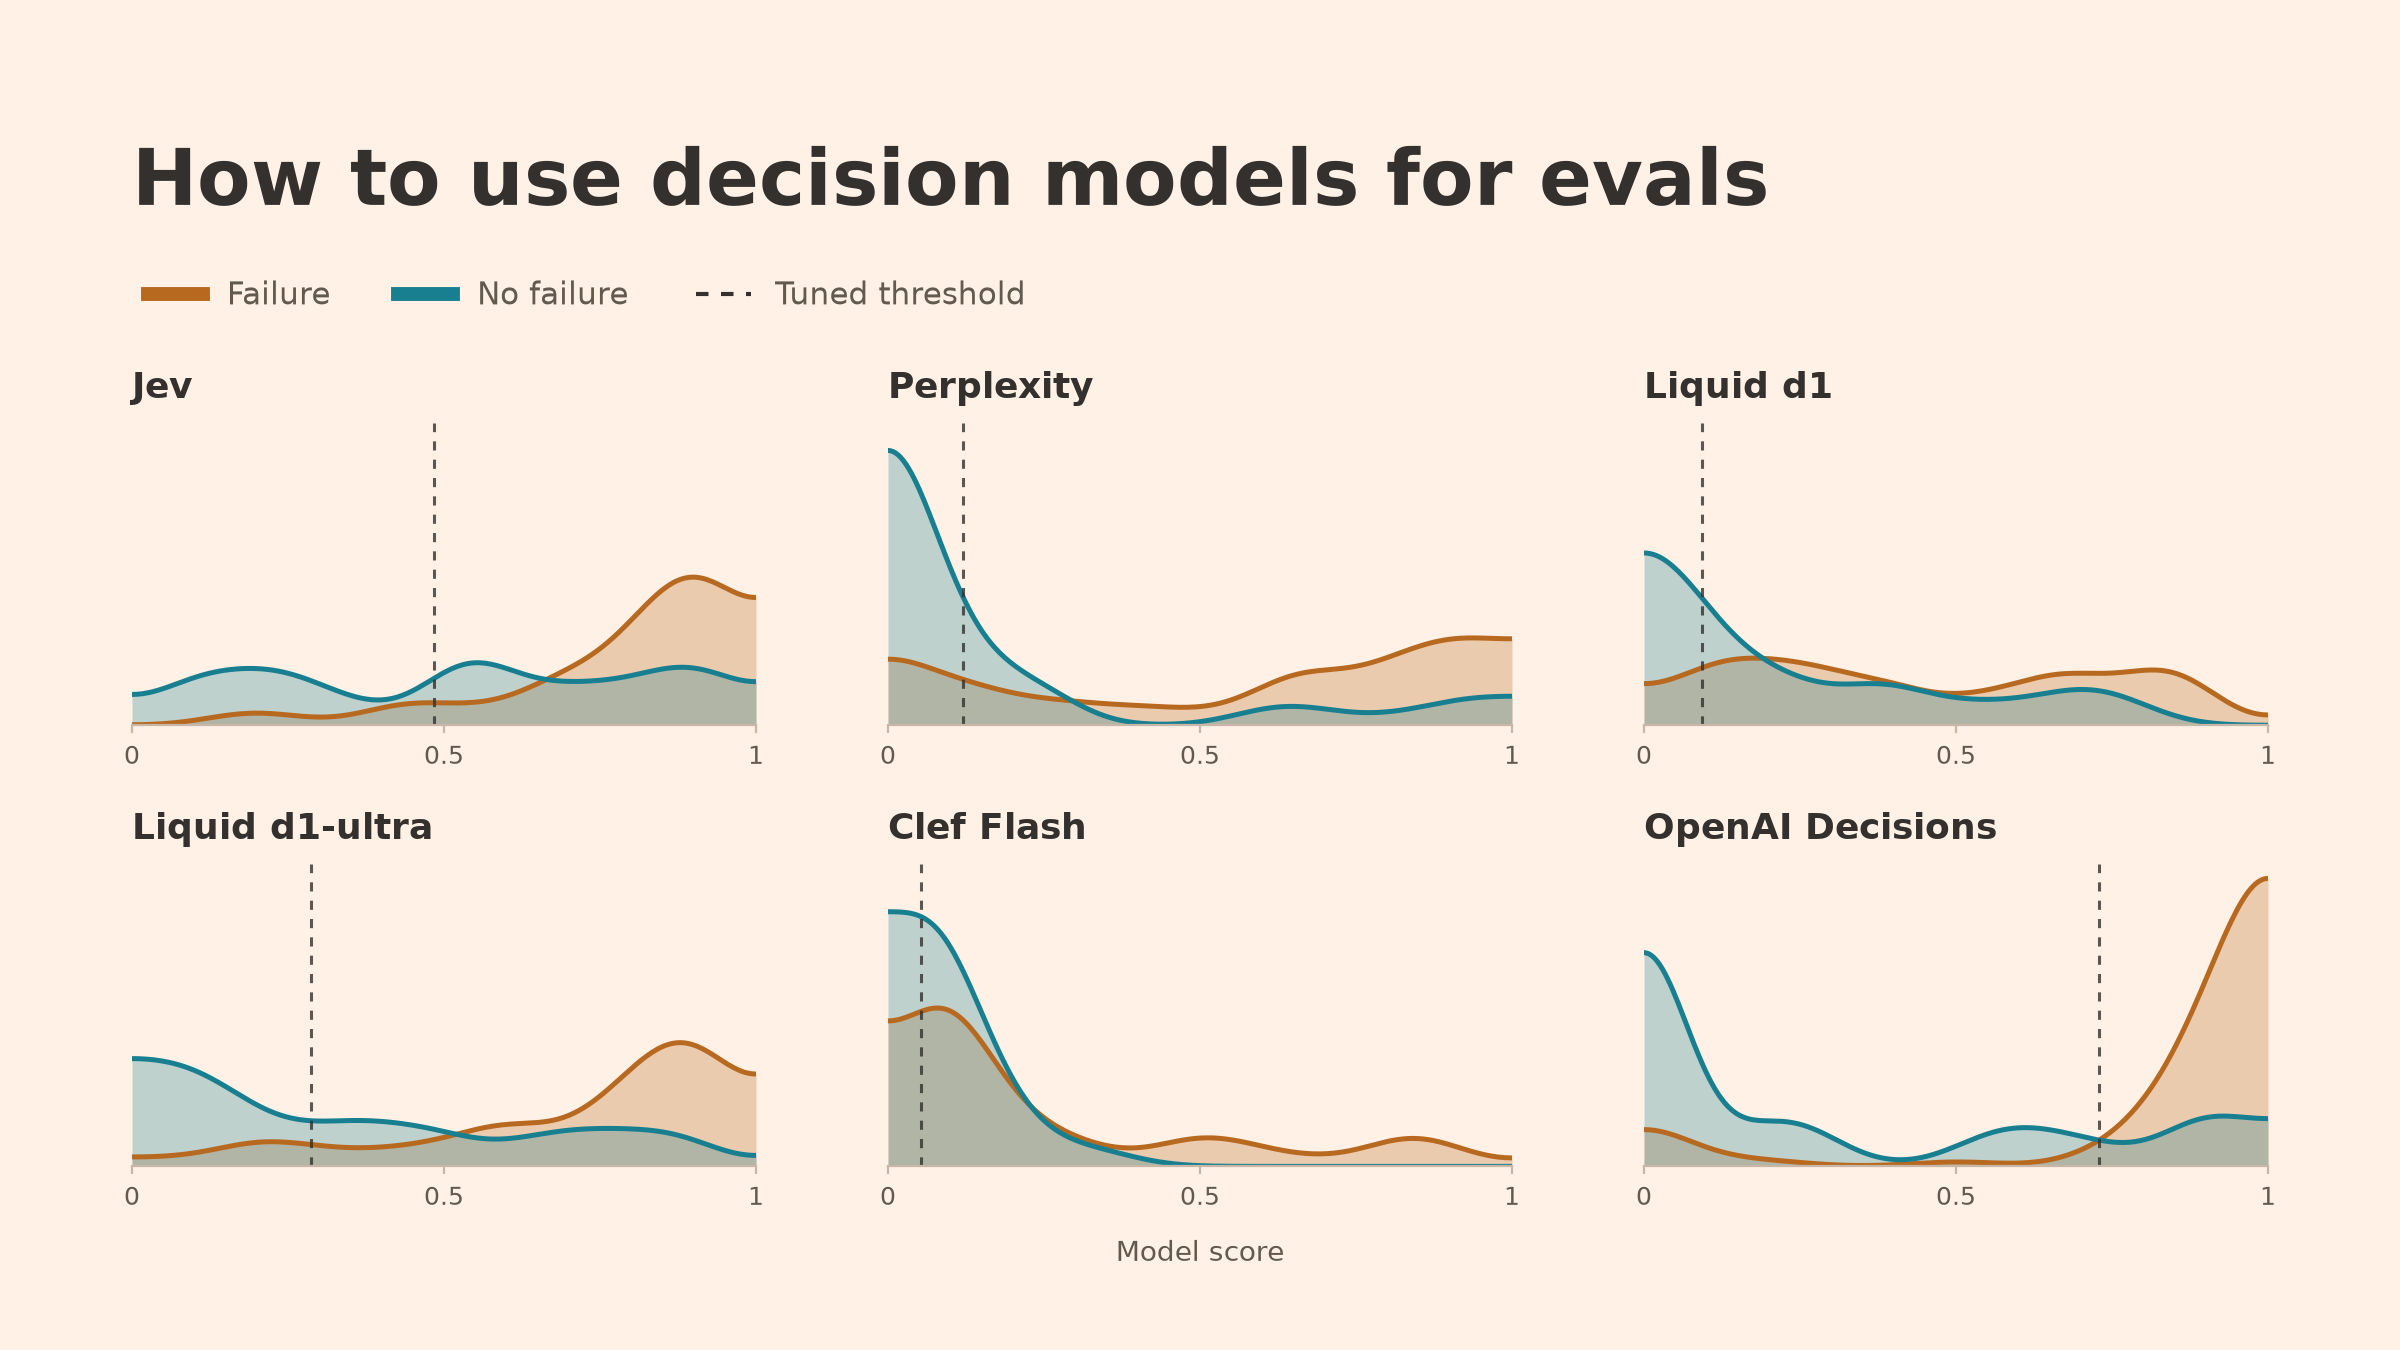
In real-world data, the score distributions of failure and normal traces often overlap, yet the numerical ranges across models remain vastly different.

Orange curves show the score density of known failure traces, and blue curves represent traces without a labeled failure; the area under each curve is normalized to 1. Scores for Clef Flash and Liquid d1 cluster in an extremely low range near 0; Perplexity misses many failures at 0.50, while OpenAI achieves clear separation between the two trace classes.
Consider how each model performs under the default 0.50 threshold:
- Cloudflare Clef Flash: Scores skew heavily low. At a 0.50 threshold, it triggers only 13 alarms across the entire dataset. While all 13 are true failures (100% precision), it misses 48 of the 61 known failures, resulting in a recall of only 21.3% (F1 of 0.35).
- Liquid d1: Also skews low. At 0.50, it catches 28 failures and misses 33, yielding a recall of 45.9% (77.8% precision, F1 of 0.58).
- Perplexity Decider: At 0.50, it catches 39 failures and misses 22, yielding a recall of 63.9% (84.8% precision, F1 of 0.73).
- Liquid d1-ultra: At 0.50, it catches 49 failures with 12 false alarms, yielding 80.3% precision and 80.3% recall (F1 of 0.80).
- OpenAI Decisions: Spreads scores out more widely. At 0.50, it catches 55 failures (90.2% recall) but triggers 15 false alarms on records without a labeled failure (78.6% precision, F1 of 0.84).
The absolute level of a model's scores does not determine quality; what matters is whether it separates failure traces from normal traces along the numerical axis. A 0.50 cutoff should never be adopted as an evaluation alarm threshold without inspecting the score distribution first.
Precision and Recall: Alarms Need More than Relative Ranking
When designing automated quality evaluation or alarm systems, engineers must balance precision and recall.
The key distinction lies in their denominators:
- Precision: True failures caught / Total alarms triggered by the system. When the system sounds an alarm, how often is it a real failure? For example, Clef Flash triggers 13 alarms and all 13 are true failures, giving a precision of 13 / 13 = 100%. If precision is too low, frequent false alarms quickly lead to alert fatigue among on-call operators.
- Recall: True failures caught / Total known failures. Out of all 61 known failures, how many does the system catch? Clef Flash catches only 13, yielding a recall of 13 / 61 ≈ 21.3%. If recall is too low, a substantial portion of failures slips past unnoticed.
The F1 score is the harmonic mean of precision and recall, balancing both metrics, but it is not standard accuracy. In practical operations, one cannot blindly chase a high F1 without satisfying minimum baselines.
For an automated ticketing alert system, for example, the authors set an illustrative operational baseline in this evaluation: precision of at least 80% and recall of at least 80%. This means at least 80% of triggered alarms are real issues, while at least 80% of known failures are intercepted on the spot. This serves as a concrete business constraint example, not a universal industry standard.

The horizontal axis represents recall, and the vertical axis represents precision. The shaded region in the upper-right corner indicates where precision and recall both reach or exceed 80%. In the full-sample threshold sweep, only OpenAI Decisions, Liquid d1-ultra, and Perplexity ever entered the shaded region to become candidate models; Jev, Liquid d1, and Clef Flash never reached it.
Across the full sweep of all 98 samples, only 3 models reached the "dual 80%" threshold within some range, qualifying them as candidate models:
- OpenAI Decisions: Performed best, covering a broad area within the shaded region;
- Liquid d1-ultra: Touched the dual 80% zone around a threshold of 0.525;
- Perplexity Decider: Reached it when lowering the threshold to approximately 0.127.
Meanwhile, Jev, Liquid d1, and Clef Flash could not satisfy both 80% minimums across this 98-sample sweep, regardless of where the threshold was set.
Adjusting the Slider: See How Moving the Threshold Shifts False Alarms and Misses
To observe how shifting the threshold alters false alarms and missed detections, this interactive demo loads the public labels for these 98 traces along with raw prediction scores from each model.
You can switch models freely and drag the slider to see how false alarms (false positives) and missed failures (false negatives) trade off on the scale.
Fixed 0.50 baseline: Precision 78.6% · Recall 90.2% · 55 caught · 15 false alarms · 6 missed.
Current threshold 0.50: 55 caught, 15 false alarms, 6 missed.
A critical fact emerges from the instant recalculation above: when the threshold is pushed so high that total alarms drop to 0, precision is mathematically undefined (0/0) and must never be mistakenly labeled as 100%. Note also that this is a pedagogical recalculation across the entire dataset; while it visually demonstrates threshold leverage, a threshold chosen on the full sample is not guaranteed to reproduce the exact same performance on unseen data.
Stratified Cross-Validation: Why Holdout Performance Drops After Training Meets the Bar
Finding a threshold that seems compliant on available data does not mean the system will reliably meet the bar after deployment.
To evaluate how well thresholds generalize, the authors used stratified 5-fold cross-validation:
- Fold isolation: The 98 traces were partitioned into 5 folds while preserving the proportion of known failures to records without a labeled failure. In each iteration, 4 folds (~78 traces) were used for training, and the remaining 1 fold (~20 traces) served as the holdout validation set.
- Constrained threshold search: For the three candidate models, thresholds were selected on training folds to maximize F1 subject to satisfying both precision ≥ 80% and recall ≥ 80%; non-candidate models underwent unconstrained F1 tuning.
- Fallback strategy and holdout verification: When a candidate model found no threshold meeting both 80% requirements on a training fold, the rule fell back to unconstrained F1 maximization, logging that fold as infeasible. The chosen threshold was then evaluated on the corresponding holdout validation fold. All holdout fold predictions (including fallback folds) were included in reported results.
The authors conducted 20 rounds of 5-fold cross-validation, totaling 100 training splits:
- OpenAI Decisions: Successfully found a threshold meeting dual 80% criteria across all 100 training splits; on the holdout validation sets, its average performance reached: 86.9% precision, 86.2% recall, and an F1 of 0.865. This represents average performance across splits; individual folds and real-world deployment performance may vary.
- Liquid d1-ultra: Failed to find a threshold meeting dual 80% criteria on 29 training splits, triggering fallback to unconstrained tuning; its average holdout precision dropped to 75.9% (81.7% recall, holdout F1 of 0.787).
- Perplexity Decider: Failed to meet the bar on 36 training splits, triggering fallback; its average holdout precision was 75.4% (82.5% recall, holdout F1 of 0.787).
Thresholds selected on training sets cannot eliminate boundary sensitivity caused by sample perturbation; performance drops on unseen data are normal.

Hollow circles represent performance across the 98 traces under the default 0.50 threshold, while solid circles represent mean holdout F1 scores after cross-validation tuning; the first three are candidate models, and the latter three in gray did not meet the dual 80% constraint. Holdout F1 for Clef Flash improved from 0.35 to 0.78, Liquid d1 from 0.58 to 0.79, and OpenAI from 0.84 to 0.87. However, Jev dipped slightly from 0.79 to 0.78, and Liquid d1-ultra from 0.80 to 0.79. This demonstrates that tuning thresholds on training data does not guarantee improvement on holdout validation data.
Additionally, F1 is not the only optimization objective. When a business has explicit preferences regarding false alarms or missed detections, F-beta scores can be used (weighting precision higher when beta < 1, or recall higher when beta > 1) to select thresholds aligned with business goals.
Complete Prompt for Having a Coding Agent Tune Thresholds
If you have accumulated labeled traces and raw model scores, you can use the author's suggested prompt to have a coding agent run cross-validation automatically. Note that this sample prompt instructs the agent to report splits where no threshold qualifies rather than relaxing either requirement, differing from the fallback strategy used in the experiment.
Using my saved model scores and binary labels (1 means failure), tune a decision threshold to maximize F1 while requiring at least 80% precision and 80% recall. Use stratified five-fold cross-validation, choosing thresholds on the training examples and measuring performance on the remaining examples. If comparing models, use the same splits for each. Only select thresholds that meet both minimums on the training examples. If none qualifies, report that rather than relaxing either requirement. Report validation precision, recall, and F1, along with any splits where no threshold qualified or validation performance fell below my minimums. Compare with the default threshold of 0.50. Reuse the saved scores without making new model calls.
Performance vs. Cost Trade-offs: Choosing Among Candidate Models
After tuning customized thresholds for each model, model selection comes down to performance vs. cost trade-offs.
Cost figures here were calculated from API token consumption across 100 evaluations combined with rate snapshots from the experiment (performance reflects the 98 production traces, excluding 2 internal QA samples). Pricing for Liquid was re-benchmarked as noted in the study: d1 updated from $0.04 to $0.02 per million input tokens, and d1-ultra at $0.042; other models retained rates recorded during the experiment and do not represent unified current market prices.

The horizontal axis shows API cost per 100 evaluations (in cents), while the vertical axis shows mean holdout F1 performance across 5-fold cross-validation. Solid circles mark candidate models, with a dashed line connecting Perplexity and OpenAI Decisions to indicate the cost-F1 frontier among candidates. Gray crosses denote models that failed to meet the dual 80% constraint. Perplexity emerged as the lowest-cost candidate at 0.82 cents per 100 evaluations, while OpenAI achieved the highest F1 of 0.87 at 3.72 cents. This frontier applies solely to this evaluation task and cannot be generalized directly to all future scenarios.
Breaking down the detailed performance of the three candidates:
- Perplexity Decider 1.1: Costs 0.82 cents per 100 evaluations, with a mean holdout F1 of 0.79 (0.787289 to six decimal places), mean holdout precision of 75.4%, and recall of 82.5%. It represents the lowest-cost option among candidate models.
- Liquid d1-ultra: Costs 1.52 cents per 100 evaluations, with a mean holdout F1 also rounding to 0.79 (0.786636 to six decimal places, slightly different from Perplexity), mean holdout precision of 75.9%, and recall of 81.7%. Along the frontier of these three candidates, its unit cost is higher than Perplexity despite a similar holdout F1.
- OpenAI Decisions (GPT-6 Luna): Costs 3.72 cents per 100 evaluations, with a mean holdout F1 of 0.87 (0.865463 to six decimal places), mean holdout precision of 86.9%, and recall of 86.2%. While roughly 4.5 times more expensive than Perplexity, its mean precision and recall both remained above 80% in this experiment.
Among non-candidate models, Liquid d1 achieved a holdout F1 of 0.79 on the 98 traces after tuning at an extremely low cost (0.72 cents), but was excluded from candidates because it failed to satisfy both 80% precision and 80% recall in the earlier 98-trace full-sample sweep.
This benchmark did not compare latency under standardized conditions. In production deployments, response latency depends heavily on request batching and concurrency, geographic proximity to provider infrastructure, rate limits, tail latency, and throughput constraints; models cannot be ranked on speed based solely on single-run average response times.
Can Scores Be Treated as Probabilities? Model Calibration and Platt Scaling
Beyond binary "pass/fail" classification, some teams also seek to use decision model scores directly as confidence scores or failure probabilities.
Calibration means that if a model outputs a failure score of 0.80, approximately 80% of traces receiving similar scores should actually contain failures. In empirical testing, however, raw scores from certain models deviate significantly from real-world event frequencies.

The left plot shows raw scores; the right plot shows probabilities adjusted via Platt scaling. The horizontal axis represents predicted failure probability, the vertical axis shows the observed proportion of failures within each bin, and the dashed diagonal line indicates perfect calibration. Each point represents roughly 20 traces with similar scores. After calibration, Clef Flash, Perplexity, and Liquid d1 shift noticeably closer to the diagonal.
Examining deviations in raw distributions:
- Samples were partitioned into 5 bins from lowest to highest predicted probability (19 or 20 traces per bin). Points above the diagonal indicate that the model understates failure risk; points below indicate overstated risk.
- Cloudflare Clef Flash: In one bin, the model predicted an average failure probability of only ~8%, yet 60% of traces in that bin actually contained failures. This proportion describes that specific bin; risk for future individual traces must still be validated on new data.
- Perplexity and Liquid d1: Similarly underestimated failure risk across several bins.
To adjust for such distortions, a standard technique is Platt scaling. In practice, this involves fitting a smooth curve (logistic regression over log-odds) that maps raw scores to calibrated probabilities using the training fold's scores and 0/1 labels, and then applying this fitted mapping to the holdout validation fold. Cycling across folds and aggregating holdout predictions avoids fitting and evaluating on the same data.
Several practical nuances apply when calibrating:
- Some models required little adjustment on this dataset: Raw scores for Jev 1.13 and Liquid d1-ultra were already close to the diagonal on this data, so scaling produced minimal change. This reflects behavior on this specific dataset rather than an inherent, universal property of either model.
- Calibration is sensitive to the fitting method: Calibration is typically evaluated using the Brier score—the mean squared difference between predicted probabilities and actual 0/1 labels (lower is better), reflecting both discrimination and calibration. Under the log-odds Platt fit reported in this experiment, OpenAI Decisions saw its Brier score tick up slightly from 0.159 to 0.164, indicating slightly higher probability error without implying degraded ranking discrimination. In contrast, an exploratory refit directly on the probability scale brought OpenAI's Brier score down to 0.154, demonstrating that calibration outcomes are sensitive to functional form and are not guaranteed to be optimal on unseen data.
Complete Prompt for Having a Coding Agent Evaluate Calibration
Using my saved failure probabilities and binary labels (1 means failure), test whether Platt scaling improves each model’s probabilities. Use stratified five-fold cross-validation with the same splits for every model. Fit the calibration mapping on each training split and apply it to the remaining traces. Fit on log-odds, clipping probabilities away from 0 and 1 first. Plot predicted probabilities against observed failure rates before and after calibration. Report Brier scores (lower is better), and explain which models improved or got worse. Reuse the saved scores without making new model calls.
Practical Rules for Production Deployment
Before using decision models for automated evaluation in production AI systems, consider the following practical takeaways:
- Narrow evaluation scope (one judge per failure mode): This benchmark used a broad overarching evaluation rubric. In production, building dedicated judges for each specific failure mode (such as separate judges for booking failures and human-handoff compliance) is recommended. The authors expect that a narrower task focus may reduce the performance gap between smaller and larger models.
- Start large, then evaluate smaller alternatives: Identify a large model that performs acceptably on the task first, then test whether smaller models can achieve comparable results at lower cost. High-quality human annotation remains the foundation of evaluation; always reserve an independent test set for final verification when developing or optimizing prompts.
- Tune custom thresholds to business requirements: Never stick with the default 0.50 threshold blindly. Establish operational requirements for precision and recall, and identify appropriate thresholds via cross-validation on training data. Whenever prompts are modified or models are updated, re-evaluate thresholds and calibration.
- Decouple discrimination, decision thresholds, and probability interpretations: A model's ability to rank good and bad traces does not make the default threshold usable, passing training thresholds does not prevent validation drops, and score magnitude cannot be treated directly as true failure probability.
Reusable Practice Workflow for Readers
To experiment with this analysis directly, the author published the chart dataset in JSON format (containing matching 0/1 labels and prediction scores across all models for the 98 traces):
- Save the public scores and labels locally as
chart-data.json(labelscontains 0/1 tags, andmodels[].scoresaligns with traces in the same sequence); - Hand the data to a coding agent and send the threshold-tuning prompt first to observe holdout validation precision, recall, and threshold selection under cross-validation;
- If business applications require converting scores into calibrated probabilities, send the calibration prompt to evaluate whether Platt scaling reduces Brier scores across models.
The original customer support conversations are private, but external readers can use the public scores and labels to practice threshold tuning and probability calibration; running new model evaluations from scratch still requires the raw conversation traces.
Appendix: Evaluation Prompts Used in the Benchmark
In the benchmark, Perplexity, Liquid d1/d1-ultra, Clef Flash, and OpenAI Decisions received a unified text prompt, while Jev received structured JSON instructions through its dedicated API.
View General Evaluation Prompt
General Text Prompt
Decide whether `messages` contains at least one substantive failure, risk, or quality problem in the AI assistant's behavior or tool use. This is one complete production trace from an AI that handles apartment-leasing customer support over phone or messaging. The trace includes the conversation plus any tool calls and tool outputs.

Evaluate the AI assistant and its tool use, not the customer. Treat system messages inside `messages` as the instructions governing the assistant's behavior and allowed capabilities. Inspect the full trace, including final turns and all tool calls and outputs. Base the judgment only on evidence visible in this trace. Do not assume external policies, channel behavior, or business requirements that are not present. Do not assume every trace failed. A short, ambiguous, or inconclusive trace is not an issue unless visible evidence establishes a substantive failure.

Return the probability that at least one substantive issue is present; the issue does not need to be named or clustered.

Count as an issue when supported by the trace: the assistant contradicts an applicable system instruction or tool result; makes an unsupported factual or operational claim; misses, misuses, repeats, or falsely claims completion of a required tool action, transfer, booking, cancellation, follow-up, or confirmation; materially misunderstands or leaves an explicit user request unresolved; or exposes internal actions, placeholders, or broken content to the customer in a way that materially harms the interaction.

Do not count as an issue: a minor stylistic preference with no meaningful effect; a failure caused only by the customer's behavior; internal tool metadata that was not exposed to the customer and did not cause an incorrect response; a hypothetical concern requiring information outside the trace; or insufficient evidence and inconclusive conversations.
View TypeSafe Jev Dedicated Structured Prompt (JSON)
Jev Structured Prompt (JSON)
{
  "version": "nurtureboss-any-issue-v1",
  "question_id": "has_substantive_issue",
  "type": "noul",
  "instructions": {
    "task": "Does `messages` contain at least one substantive failure, risk, or quality problem in the AI assistant's behavior or tool use?",
    "context": "This is one production trace from an AI that handles apartment-leasing customer support over phone or messaging. The trace contains the complete conversation plus any tool calls and tool outputs.",
    "evaluation_rules": [
      "Evaluate the AI assistant and its tool use, not the customer.",
      "Treat system messages inside `messages` as the instructions governing the assistant's behavior and allowed capabilities.",
      "Inspect the full trace, including the final turns and all tool calls and outputs.",
      "Base the judgment only on evidence visible in this trace. Do not assume external policies, channel behavior, or business requirements that are not present.",
      "Do not assume every trace failed. A short, ambiguous, or inconclusive trace is not an issue unless the visible evidence establishes a substantive failure.",
      "Return the probability that at least one substantive issue is present. The issue does not need to be named or clustered."
    ]
  },
  "criteria": {
    "true": {
      "definition": "At least one substantive problem is supported by evidence in the trace.",
      "examples_of_qualifying_evidence": [
        "The assistant contradicts an applicable system instruction or a tool result.",
        "The assistant makes an unsupported factual or operational claim.",
        "A required tool action, transfer, booking, cancellation, follow-up, or confirmation is missing, incorrect, repeated, or falsely claimed as complete.",
        "The assistant materially misunderstands or leaves an explicit user request unresolved.",
        "Customer-facing text exposes internal actions, placeholders, or broken content that materially harms the interaction."
      ]
    },
    "false": {
      "definition": "No substantive assistant problem can be established from the visible trace.",
      "do_not_count_as_an_issue": [
        "A minor stylistic preference with no meaningful effect.",
        "A failure caused only by the customer's behavior.",
        "Internal tool metadata that was not exposed to the customer and did not cause an incorrect response.",
        "A hypothetical concern that requires information outside the trace.",
        "Insufficient evidence or an inconclusive conversation."
      ]
    }
  }
}
Members can copy or download the full Markdown, and let their AI subscribe and ask.
Found this useful? Leave your email — every new explainer, the moment it's out. Unsubscribe anytime.