a16z's 14 charts make the case that AI investment isn't a bubble
Along the way, they debunk three widely misread metrics: the falling token chart, the six-month order backlog, and that 5% entry-level job stat.
- Vertiv, which makes data center cooling and power gear, fell $76 million short of its delivery targets. That got spun as a sign of an AI bust, so a16z checked public data against that narrative three ways.
- Their conclusion: demand is unusually high, but the data can't say whether supply chains are also straining. Along the way, they unpack three widely misread numbers.
- One of those — the viral "AI demand is collapsing" curve — isn't actually measuring demand at all.
AI compute and hardware demand is red-hot, but supply chains are strained
a16z (Andreessen Horowitz) just published a new issue of Charts of the Week, its weekly data column, with 14 charts, all drawn from public data. The process is the interesting part. Everyone's arguing about whether AI is a bubble, and most arguments rest on stock prices and vibes. This issue instead walks through Census Bureau, NY Fed, Indeed, and ADP numbers to check three specific questions: Is AI infrastructure demand fading? Are entry-level jobs being killed by AI? Is real corporate AI spending shrinking? Where the data runs out, it says so plainly.
A data-center cooling company just missed its shipments
Vertiv supplies cooling and power gear for data centers and has been one of the big winners in this build-out. Its Q2 2026 revenue came in at $3.27 billion, up 24% year over year.
But it missed its own guidance by about $76 million this quarter, and missed the Street's higher consensus by about $120 million. The $76 million gap is roughly 12% of its year-over-year increase of $630 million (that math is ours).
Management's explanation was "minor timing shifts" — temporary supply chain congestion, plus multi-phase project execution getting more complex as deployments scale. In other words: the orders are there; the gear just didn't ship on time.

If Vertiv is hitting supply chain issues, others likely are too. Do those show up elsewhere? Three leads to chase.
AC orders doubled in a decade; material handling on the same chart spiked and fell back
The first lead is orders. The Census Bureau tracks manufacturing orders by category, and among the data center–adjacent categories, air conditioning stands out the most.

The AC category doubled (turbines, generators, and power distribution rose about 30% over the same stretch — no doubling). That's not hard to explain: high-performance computing is basically turning electricity into heat. More machines, more heat, tighter supply for cooling gear. Generation and distribution rising with it follows the same logic.
There's a fourth line on the chart: material handling equipment. It was around 2.4 in 2016, spiked to 3.7 in 2023, and is back to 2.85 now — up, down, and clearly different in shape from the three rising lines above. The original post doesn't mention this line; we read it off the chart ourselves.
The second chart looks at the other side of the same coin: orders already placed but not yet shipped by factories — "unfilled orders."

A growing pile of unfilled orders usually means demand is outstripping supply. But there's an ambiguity: it could be factories getting stuck, or demand simply too big to handle. To separate those two, you need a different metric.
The backlog would take about six months to clear — but that number has barely budged since 2024
Here's the metric that separates them: the backlog ratio. Unfilled orders divided by monthly shipments, with the result expressed in "months."
Applied back to the data:

GSCPI is an index the New York Fed builds from shipping costs, delivery delays, and similar data. The reading tells you how many standard deviations above normal things are. The two lines on this chart are telling different stories:
The backlog ratio says: high, but essentially unchanged for three years — that's persistently strong demand, not a sudden supply chain breakdown. GSCPI says: global supply chains are genuinely tightening, to nearly twice a normal fluctuation. a16z's call is that the global supply chain problems are real, but whether any of it has specifically hit data center gear isn't visible in this data.
Three of four import categories hold steady; only power conversion gear is down about 20%
The third lead is physical imports. The Census Bureau counts both dollars and units, so you can separate "money spent" from "goods received." If supply chains were truly jammed, the unit counts should drop.

Only power conversion stands out: units down more than 20%, while dollars spent are up more than 20%. The other three categories all have latest unit readings between 90 and 110, roughly the same as last January. There's real month-to-month noise — low of 64, high of 126 — but no sustained downward drift. So conversion gear may genuinely be stuck, and everything else is basically unchanged.
Here's the question this data can't answer: how much higher would imports have been without supply chain friction? The original post acknowledges this itself.
All three leads point the same way: orders doubled over a decade, backlogs are running at 5.7 months, and import volumes haven't fallen. Everyone is more eager to buy than to sell. Whether supply chains are adding their own friction, none of these three can say. But there's zero sign of cooling demand in this batch of data.
Entry-level roles are scarce, but AI isn't the main culprit — remote work is
a16z has argued before that AI is currently creating more jobs than it destroys. But they concede one persistent weak spot: entry-level roles are hard to find. This issue's new observation is that entry-level tech jobs have always been a small slice of the pie, and that slice has barely budged in years.
Entry-level tech jobs were never a big slice of the pie

This chart is easy to misread: it measures "within each occupation, what share of postings are entry-level," not "entry-level jobs as a share of the whole market." The software development row means that about one in twenty-five postings in that field is labeled entry-level.
What's actually being squeezed is mid-level; senior roles are still growing

In the tech panel, that thin entry-level slice has barely moved in seven years. What's actually shifting is the middle: mid-level share is down about 7 points, and senior is up about 9 points. The squeeze is on people with a few years of experience who haven't reached senior yet.
If you want an industry where entry-level hiring genuinely is shrinking, healthcare fits better than tech: its entry-level base is large, and it's been falling steadily — about 44% in 2020 to about 37% in 2025. (The original post says "since 2023," but the chart shows the decline starting in 2021.)
Companies can now hire experienced people from anywhere in the world
The shares haven't moved, but young people do feel it's harder. The original post attributes that gap to remote hiring: a company no longer has to hire an inexperienced person locally.

All the "return to office" mandates have been loud, but this line hasn't moved.

Nearly half of workers in those two industries are in some form of long-distance arrangement, almost double the pre-pandemic level. a16z itself calls the number "almost too high to believe," but the direction holds up to common sense.
AI probably didn't take your job. Remote work very likely did.
a16z Charts of the Week · Moses Sternstein
Real AI usage and enterprise spending remain strong — no signs of a bust
This is the most practical section: is the real money companies spend on AI shrinking? a16z's answer is no — but first they have to dismantle a widely misread indicator.
That "AI demand is collapsing" curve isn't actually measuring demand

This chart has been circulating online as "proof" that AI demand is about to collapse. But the index measures token expenditure intensity: how many tokens are being used and what each one costs, rolled into one number. It is not pure usage. ⚠️ SiliconData hasn't published the exact methodology, so we only know it's a function of both volume and price.
In other words: expensive token usage is rising, cheap token usage is rising faster, and the average price per token gets dragged down. The index drifts lower while total spend is actually going up.
That's the mechanism. Whether it's happening right now, the original post can't say for sure. But another batch of data at least shows total spend is still climbing.

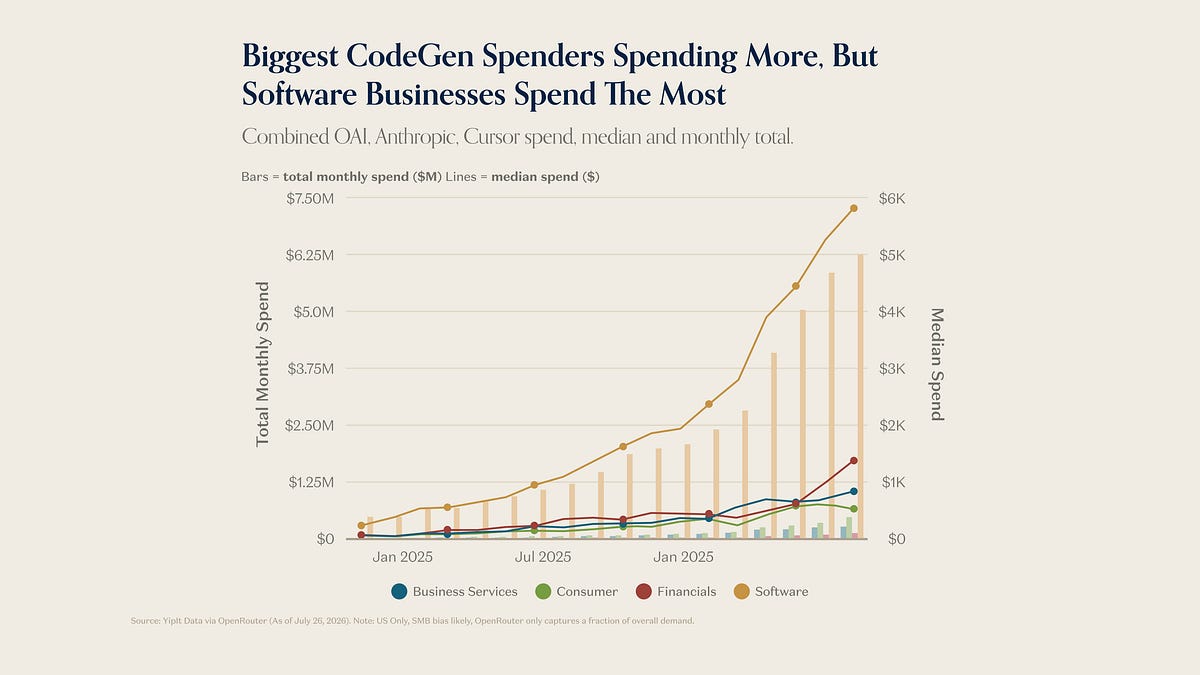
Software spends the most — no surprise there. The outlier is financials: its median curve has turned the steepest in recent months, moving from behind business services to second place.
What's really rising: the price of renting a GPU
If the token index is an easy-to-misread metric, GPU rental prices are far more direct: if you want the card, you pay by the hour.

The other line is term pricing: locking in a one-year lease and price in advance. Spot reflects this week's tightness; the term rate embeds expectations for a year out.

Eight months, and the one-year lockup went from about $1.79 to about $2.43 — up about 35%. On the far left of the same chart (0 months, i.e., spot), the same period went from about $1.99 to about $2.76, up about 39%. Spot actually rose a bit more; both ends moved together. (The original post says "almost 40%," but based on the two points at 12 months on this chart, it's 35%.)

Taken together, this issue is really a demonstration of how to read data: take an alarming signal seriously, then go layer by layer to see if other data confirms it — and when you hit a wall, say so plainly. This batch of data shows no sign of demand cooling, but it only answers the "demand" question.
Three numbers taken as proof of an AI bust — a16z finds the real problem is in the reading
a16z used 14 public-data charts to check orders, jobs, and GPU rents. Here's the whole thing in one illustrated page.
↓ One page, with one animated figure
Vertiv makes data center cooling and power gear, and it's been one of the big winners in this build-out. Its Q2 2026 revenue came in at $3.27B, up 24% YoY — but it missed its own guidance by about $76M and the Street's consensus by about $120M. Management blamed temporary supply chain congestion. If Vertiv can't ship, others probably can't either, so a16z went checking three sets of public data.
Of the three leads, the backlog ratio is the easiest to misread. The math: orders placed but not yet shipped, divided by monthly shipments, expressed in "months."
✔ It peaked at ~7.1 in fall 2022 and has been stuck between 5.5 and 6 since 2024
✘ A high number does not mean supply chains suddenly broke — it's been flat for three years
Blame for "new grads can't find work" often lands on AI. a16z pulls the Indeed data: tech's entry-level share has barely moved in seven years. What's actually being compressed is the middle layer. (The widely cited "tech entry-level is down to 5%" is, in fact, the figure for software development as a single occupation at about 4%; tech overall sits between 6% and 8%.)
Mid 43%
Senior 48%
Mid 36%
Senior 57%
a16z attributes the gap young people feel to remote hiring: the share of information industry workers in long-distance arrangements (living far from the office, not commuting) rose from about 28.5% in Feb 2020 to about 46.5% in Feb 2026. Companies no longer have to hire an inexperienced person locally. As author Moses Sternstein puts it: "AI probably didn't take your job. Remote work very likely did."
SiliconData's Token Cost Index went from about 1.00 in December to a peak of about 2.11 in mid-May, then fell to 1.4520. This chart gets passed around as proof that "AI demand is about to collapse." But it measures token expenditure intensity: how many tokens are used and what each one costs, rolled into one number.
The other side of the ledger is far more direct: if you want the card, you pay by the hour — and more people are willing to lock in a one-year lease and price in advance. Committing to a year means you expect tightness to last.
in dollars.
Total Q2 revenue:
$3.27B, up 24%
machinery orders,
nearly doubled in a decade
- × Each customer
waits 5.7 mo - × Supply chain
broke suddenly
Mid 43% → 36%
Senior 48% → 57%
The viral "tech
entry-level at 5%"
refers to software
development only
how hard people
are spending.
cheap tokens up
even faster,
average price
dragged down.
for a 12-mo H100
lease.
Nov 2025: ~$1.79,
up ~35% in 8 months
Members can copy or download the full Markdown, and let their AI subscribe and ask.
Found this useful? Leave your email — every new explainer, the moment it's out. Unsubscribe anytime.