a16z:全球AI 让应用数量暴涨,但用户和付费却没有跟上...
13 张数据图揭示软件业的新瓶颈:做出产品越来越容易,赢得用户、收入和持续经营能力越来越难。
AI 正在让软件供给变得廉价,用户和收入却没有一起增长。当“把产品做出来”越来越容易,真正稀缺的能力已经移到另一端:找到需求、获得注意力、让人付费,并在资金变贵后活下去。
a16z 汇集的 13 张数据图,拍下了这种错位。应用商店塞进更多新品,大多数仍跨不过冷启动;AI 生产力工具吸走了最亮眼的增长,个人付费却还没有成为大众习惯;少数年轻公司更快冲到独角兽,上一轮扩张起来的公司则进入集中出清。软件股和麻州的数据又把同一个问题推向成熟公司与现实经营环境:技术供给变多,并不会自动创造同等规模的商业需求。
代码不再稀缺,用户注意力成了真正瓶颈
a16z 引用的研究把 2025 年 2 月以后标为“代理编码时代”,即 AI 开始更多地承担连续编程任务。此后,iOS 每月新增应用从约 3 万至 5 万款升到约 12 万款,Chrome 插件从约 3,000 款增至 2 万款以上。Android 则从近期低谷回升到约 10 万款,大致回到 2021 年高位附近。iOS 和 Chrome 冲出了原有区间,Android 的变化更像一次强劲反弹,三者共同造成的结果是:应用商店突然变得更拥挤。
共同点出现在需求端:新增应用暴涨,用户评分和下载总量没有同步增加。做出产品的门槛下降了,找到第一批真实用户反而更拥挤。

a16z 用“逃逸速度”形容新应用跨过最基础的冷启动门槛:iOS 至少获得 10 个评分,Android 超过 100 次下载,Chrome 插件至少获得 10 次下载。相对 2025 年 1 月,达到这些门槛的新品比例分别下降约 8、3 和 14 个百分点。AI 能帮助开发者更快生成和上架产品,却没有替产品解决分发与需求。
整个应用市场也没有因为供给增加而明显变大。Sensor Tower 对美国全品类应用的监测显示,从 2024 年 12 月到 2026 年 8 月,总收入约增加 2%,总使用时长增加 7%。更多应用进入商店,分到的仍是一个增长有限的消费盘子。

把总盘拆开,AI 的价值已经出现,却高度集中。生产力工具的使用时长约增长 55%、收入约增长 110%,主要由 ChatGPT、Claude、Gemini 与 Grok 拉动。开发者工具也增长很快,但整体盘子很小,Replit 是其中最突出的产品;餐饮类收入约增长 125%,体量同样较小,而且使用时长几乎没变。
大盘另一端正在收缩:游戏的使用时长约下降 3%、收入约下降 15%,生活方式收入约下降 30%,图书收入约下降 40%。少数头部 AI 应用创造的新收入,被这些成熟大类的下滑抵消了一部分,整个市场的增长因此高度集中在少数赢家。

真正卡住消费级 AI 的,是大众付费还没有形成。2023 年第一季度,各年龄段自掏腰包购买 AI 的比例都不到或接近 1%;到 2026 年第一季度,Consumer Edge 给出的整体水平升到约 3%。增长明显集中在年轻人:18 至 24 岁约为 6%,65 岁以上约为 1.4%,相差近 4 倍。
这里的约 3% 指美国消费者用个人信用卡或借记卡购买 AI 服务,企业和雇主采购不在其中。它回答的是消费市场最关键的问题:大量人已经在使用 AI,愿意自己掏钱的人仍很少,而且付费习惯首先在年轻人中形成。

少数新公司跑得更快,更多科技公司开始用增长换生存
消费端还在建立付费习惯,创投端已经出现一批加速成长的新公司。SVB 的数据显示,全部活跃独角兽的年龄中位数从约 12 年升到接近 15 年,当年新晋独角兽达到 10 亿美元估值时的年龄中位数却从近 7 年降至约 4.3 年,较 2023 年缩短 37%。存量公司整体变老,新进入者更早跨过估值门槛。

更快的不只是估值。排除大型 AI 算力公司后,2022 年成立的公司在第 3 年到第 4 年间,营收中位数从 280 万美元升至 560 万美元,净增约 280 万美元;较早批次在同一阶段通常只增加约 100 万美元。按增量计算,新批次的爬坡速度接近过去的 3 倍。
但快速上升的中位数掩盖了巨大的内部差距:2022 批次第 4 年营收的中间 50%,大约横跨 50 万至 1,300 万美元。新一届公司的领先者跑得更快,落后者却没有被同一条增长曲线一起带起来。

这批增长能否持续,取决于速度能否变成护城河。一个尚待验证的解释是,2022 批次中有不少借助现成模型迅速起量的 “AI wrappers”,产品增长很快,差异化却还不牢固。接下来要观察的是 2023、2024 年批次能否复现同样曲线,以及这些公司能否在模型能力逐渐普及时守住用户和收入。
在少数新公司加速的同时,更广泛的科技企业正在转入防守。金融科技、企业科技、前沿科技和消费互联网的营收同比增速中位数,从 2022 年初约 50%—80% 回落至约 15%—30%;亏损幅度同时收窄。到 2026 年第二季度,消费互联网净利润率中位数约为 -5%,金融科技约 -7%,企业科技约 -13%,前沿科技仍约 -30%。
最近三个季度融到钱的公司形成了另一组画像:营收增速中位数仍有约 63%—73%,净利润率却在 -43% 至 -60% 之间。更广泛的公司在用更慢的增长换取更接近盈亏平衡的经营状态,近期融资样本则继续用高亏损换高速增长。

上一轮创业繁荣进入出清期,B2B SaaS 占关闭样本逾四分之一
上一轮低利率时期批量成立的公司,正在集中接受生存检验。美国 VC 支持公司的失败与关闭记录,从 2023 年的 893 家升至 2024 年的 1,602 家、2025 年的 1,981 家;2026 年的虚线继续抬到 2,345 家。这条曲线要表达的重点很直接:出清没有在 2025 年见顶,还在继续加速。
2026 年成立年份已知的关闭样本中,2019 至 2021 年成立的公司占 34%,是最大的一组;2022 至 2023 年成立的占 20%,2024 年以后成立的占 9%。关闭潮的主体仍是上一轮高融资年份留下的旧 cohort。

行业分布显示,出清对象也在变化。SimpleClosure 的关闭样本中,AI 初创企业占比从 2024 年的 17.7% 降至 2025 年的 15.9%,2026 年上半年进一步降至 14.4%;B2B SaaS 则占 2026 年上半年关闭样本的 27.3%,是最大的明确类别。

B2B SaaS 原本就是创业最密集的赛道之一,因此行业存量会影响关闭样本的构成。更直接的信号是:AI 公司在关闭样本中的份额下降,传统 B2B 软件却占到四分之一以上,当前集中被清算的仍有大量上一代软件创业公司。
软件股已经反弹,经营压力先出现在下一季指引
Citrini 在 2026 年 2 月发表文章预言 AI 将终结软件行业。以 2 月中旬为 100,大、中、小市值软件公司指数随后继续下探,到 4 月触及约 91 至 94 的阶段低点;到 9 月中旬,小盘回升至约 130、中盘约 134、大盘约 127。悲观文章接近这一轮下跌的后段,软件股此后完成了明显修复。

价格反弹之后,还要看悲观预期是否已经落到真实业绩。2026 年前两个季度,统计样本中约 94% 的软件公司实际业绩符合或超过市场预期,当期结果并没有出现普遍失守。

具体分布如下:
- 第一季度实际业绩|146 家:超预期 66%,符合 28%,低于 6%。
- 第二季度实际业绩|148 家:超预期 66%,符合 28%,低于 7%。
- 第三季度前瞻指引|69 家:超预期 30%,符合 49%,低于 20%。
压力先出现在下一季。在 69 家给出第三季度指引的软件公司中,低于预期的比例升至 20%,超预期的比例从前两个季度的 66% 降至 30%。当期结果大多守住了市场预期,管理层对下一季的判断却明显转弱;股价反弹与经营预期转冷正在同时发生。
麻州创业成本高,经营场所也在近期净减少
最后一组图把问题落到具体经营环境上。设立有限责任公司(LLC)的总费用在各州差异很大:麻州约 1,000 美元,是全美中位数约 200 美元的 5 倍;加州为 890 美元,内华达 775 美元,田纳西 600 美元,特拉华 510 美元,最低的蒙大拿只有 35 美元。

这笔费用发生在公司找到客户之前,会直接压缩小企业本就有限的启动资金。再叠加用工和税费,麻州在 CNBC 的经营成本排名中位列全美第 49。对创业者来说,问题是同样一笔钱在这里能支撑的试错时间更短,公司会更谨慎地决定在哪里成立和扩张。
当地经营场所的变化也在转弱。BLS 的 Business Employment Dynamics 数据显示,麻州私营经营场所的出生/死亡比在 2021 年一度升至约 1.60 的十年高点,2023 和 2024 年则降到约 0.75。比值为 0.75,意味着每新增 3 个经营场所,大约有 4 个消失。

Pioneer Institute 根据 BLS 数据计算,麻州连续 9 个季度净减少约 17,500 处经营场所,新增速度已经赶不上退出速度。把这组变化与注册、用工和税费放在一起看,麻州面临的是整体经营环境变得更难承受:新企业启动更贵,现有经营场所也更难持续补充。
这 13 张图共同指向一个变化:AI 时代的软件瓶颈正在从生产代码,转向获得需求、形成付费、保持资本效率和承担经营成本。能做出更多应用已经不稀缺;能让用户留下、愿意付钱,并让公司在资金和成本压力下持续经营,才是更难复制的能力。
a16z:全球AI 让应用数量暴涨,但用户和付费却没有跟上...
AI 正在让软件供给变得廉价,用户和收入却没有一起增长。当代码编写成本断崖式下跌,软件上架变得极度轻巧,但全社会的时间精力与钱包盘子并未同等扩张。商业竞争的终极瓶颈,已从“做出产品”不可逆地转向“跨越冷启动、促成真实付费与在资本紧缩中求生”。
代码不再稀缺,用户注意力成了真正瓶颈
自 2025 年 2 月进入“代理编码时代”后,iOS 每月新增应用飙升到约 12 万款,Chrome 插件从约 3,000 款激增至 2 万款以上。然而,供给端的大繁荣并没有同步传导至需求端:做出产品的门槛下降了,找到第一批真实用户反而陷入空前拥挤。
衡量新应用跨过冷启动门槛的“逃逸速度”(iOS 至少 10 个评分、Android 超过 100 次下载、Chrome 插件至少 10 次下载)在各平台的新品比例中分别下降约 8、3 和 14 个百分点。整个应用市场也没有因此变大:2024 年底至 2026 年中全美总收入仅增约 2%,总时长仅增 7%。AI 替开发者解决了写代码,却丝毫未替产品解决分发与需求。
核心机制:软件价值链瓶颈的彻底倒置
当开发边际成本趋近于零,软件商业竞争的瓶颈发生根本性逆转:供给暴涨不再创造同等需求,反而在流通与变现端形成严重堰塞湖。
少数新公司跑得更快,更多科技公司开始用增长换生存
消费端建立付费习惯缓慢,创投端却出现了极端的两极分化。SVB 数据显示,新晋独角兽达到 10 亿美元估值的年龄中位数从近 7 年大幅缩短至约 4.3 年(缩短 37%);2022 年成立的公司第 3 至第 4 年营收中位数翻倍净增 280 万美元,爬坡速度达到过往批次的 3 倍。
然而同一批次内部撕裂严重:2022 批次第 4 年营收的中间 50% 横跨 50 万至 1,300 万美元,许多起量迅速的公司可能只是护城河脆弱的“AI wrappers”。与此同时,更广泛的科技企业营收增速从 50%~80% 普遍回落至 15%~30%,主动通过放缓增长换取亏损收窄以维持自保。
上一轮创业繁荣进入出清期:B2B SaaS 占关闭样本逾四分之一
低利率时代批量成立的存量公司正在集中接受生存检验。美国 VC 支持的企业倒闭数量从 2023 年的 893 家骤增至 2025 年的 1,981 家,2026 年预计突破 2,300 家。清算的主体仍是上一轮高估值年份留下的旧 cohort:已知关闭样本中,2019 至 2021 年成立的公司占到了 34%。
SimpleClosure 数据显示,AI 初创企业在关闭样本中的占比从 2024 年的 17.7% 降至 2026 年上半年的 14.4%;而 B2B SaaS 却占到 2026 年上半年关闭样本的 27.3%,为最大单一类别。当前集中退场的并非过热的 AI,而是上一代缺乏自我造血能力的传统软件企业。
股价修复掩盖指引疲软,现实营商重力加速出清
二级市场上,软件股在经历悲观恐慌后虽已强劲反弹约 30%,且当期约 94% 的企业实际业绩符合或超过预期,但经营隐忧已提前在指引中浮现:第三季度前瞻指引超预期比例从前两季的 66% 骤降至 30%,低于预期的比例则激增至 20%,管理层给出的下一季信号明显更加审慎。
现实中的营商成本更是收紧了企业的生存空间。以麻州为例,设立有限责任公司(LLC)总费用高达 1,000 美元(全美中位数的 5 倍),营商成本位居全美倒数第二。当地私营经营场所出生/死亡比跌至 0.75(新增 3 家即消亡 4 家),连续 9 个季度净减少约 17,500 处。资金与经营成本的刚性摩擦,正在加速淘汰无法形成商业闭环的脆弱供给。
AI 时代的软件瓶颈正在从生产代码,转向获得需求、形成付费、保持资本效率和承担经营成本。能做出更多应用已经不稀缺;能让用户留下、愿意付钱,并让公司在资金和成本压力下持续经营,才是更难复制的能力。
Charts of the Week: So Many Apps, So Little Time
New Breed of Unicorn; Citrini Called the Bottom; MA and CA Make it Very Expensive to Start a Business


Charts (and others) has observed that one effect of AI code gen tools has been the proliferation of code. More code has, among other things, also led to a pronounced spike in the number of apps. Everyone’s a vibecoder now, which means everyone’s an app publisher now, too.
Of course, just because there are now more apps to choose from, doesn’t mean that those apps are particularly compelling, or that people are suddenly spending more time in the app store. Supply may increase, but demand may have a life of its own.
As it happens, a recent paper sheds some light on the demand-side of the equation, and the results are pretty clear: the supply of apps has, indeed, surged . . . but, for the most part, no one is really using them:
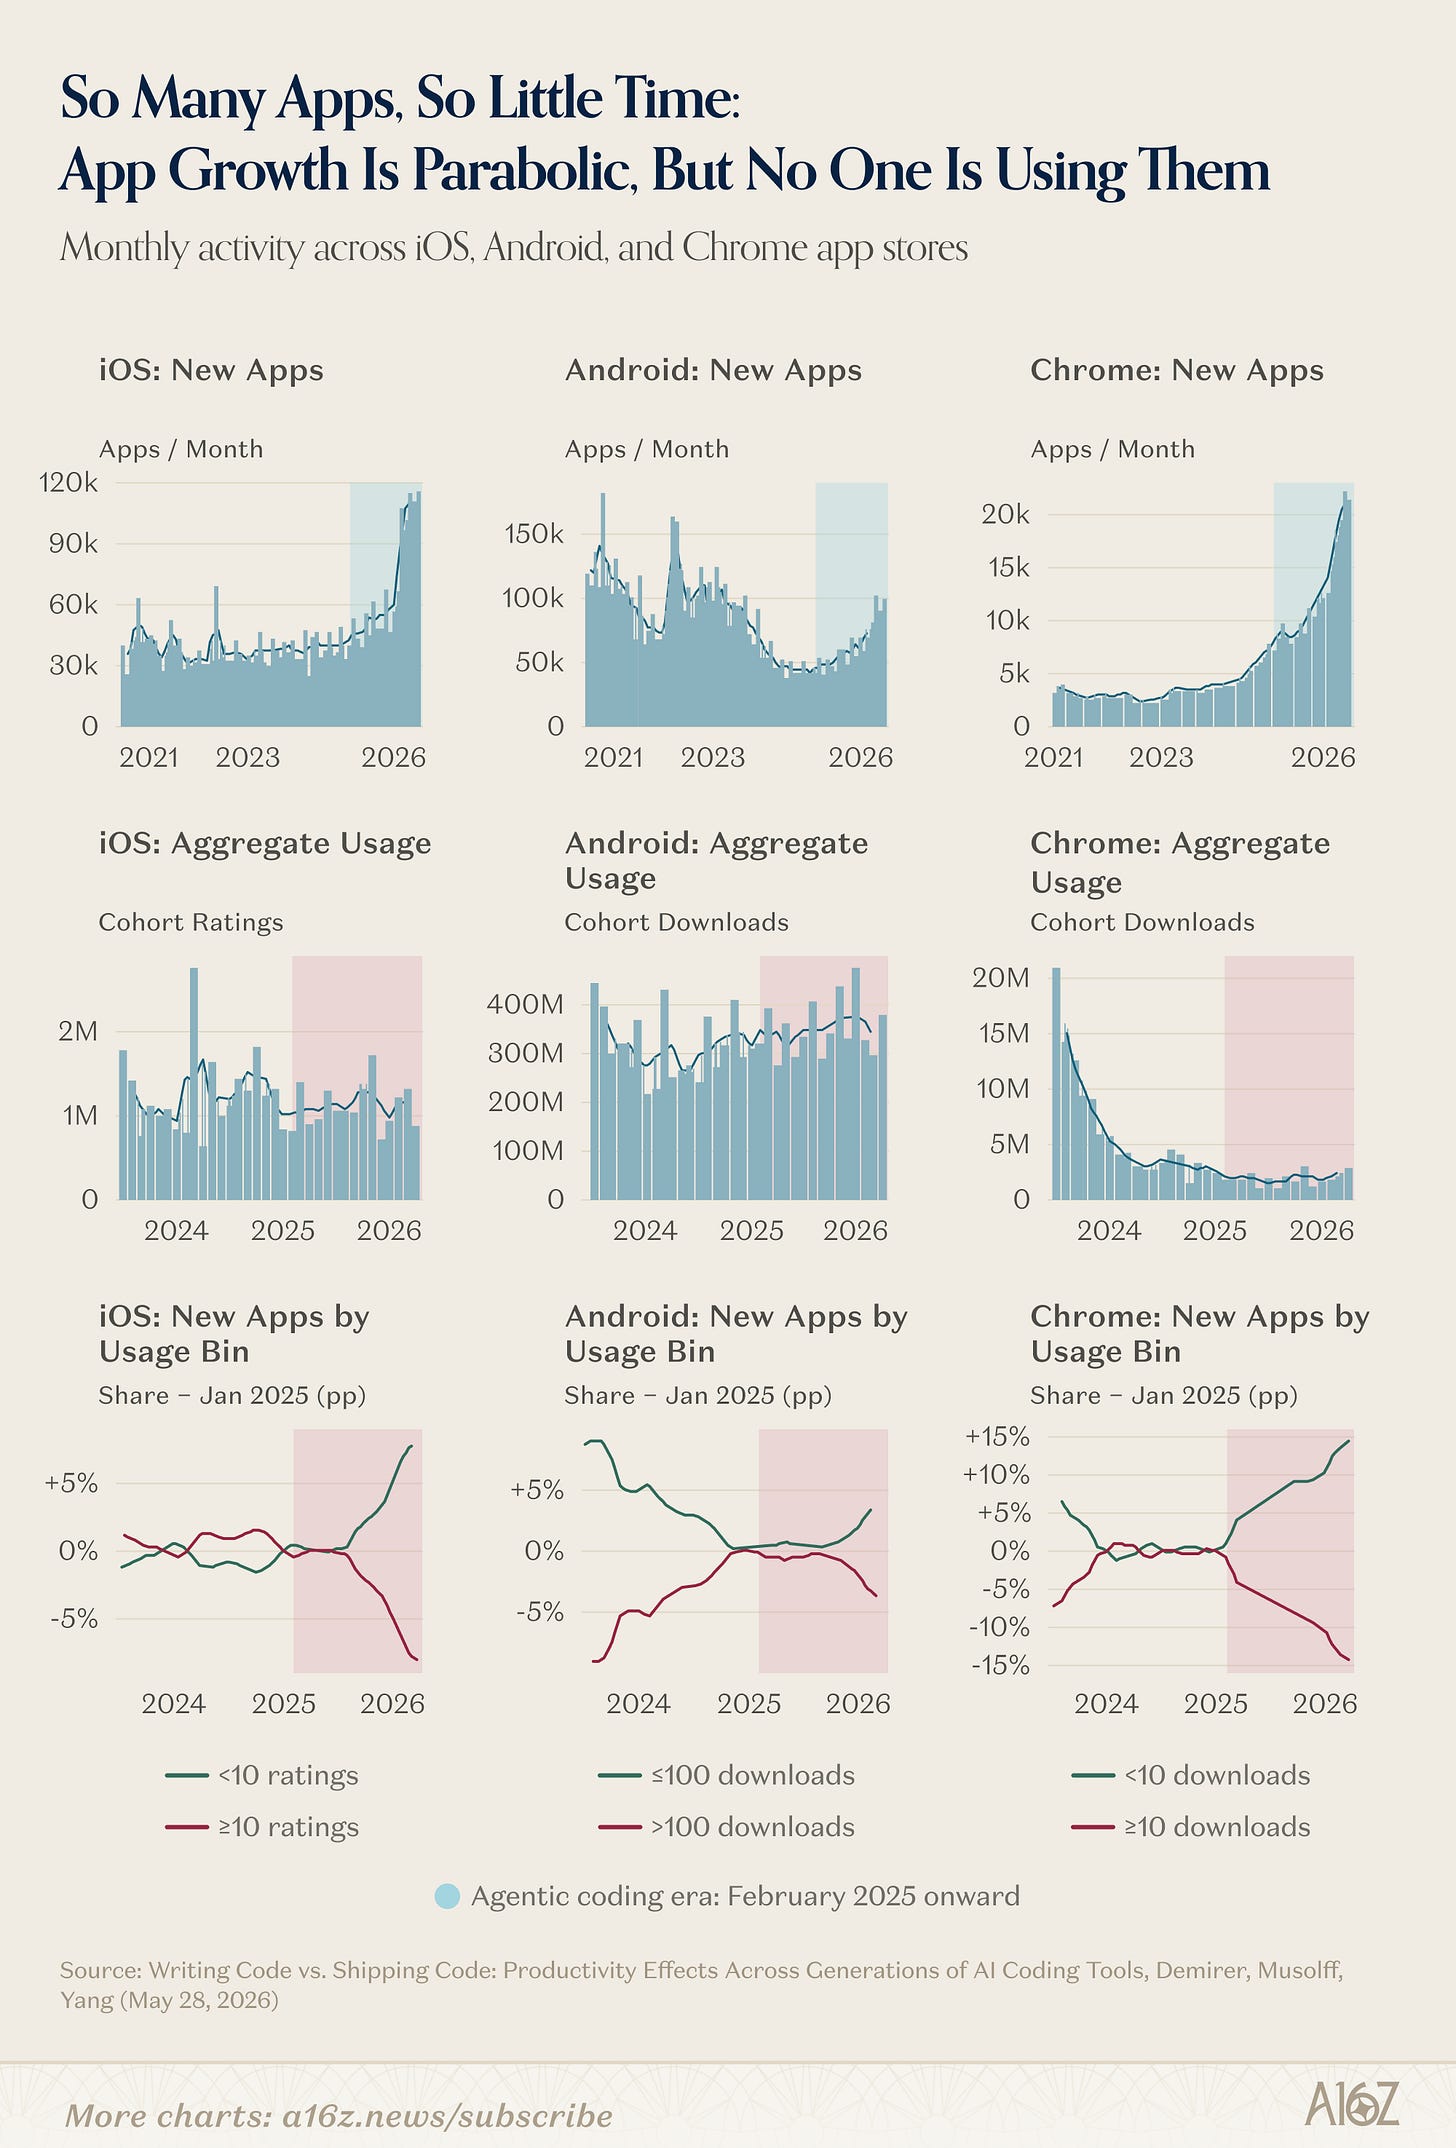
- Across iOS, Android and Chrome, total new apps per month have variously doubled or quadrupled.
- On the other hand, the number of downloads (or ratings, in the case of iOS) has been pretty much stagnant.
- And, in case you’re wondering whether there’s been any share-shift, such that aggregate downloads are flat, but within that universe are still some winners—well, the researchers cover that one, as well. Alas, the share of apps with any indication of escape velocity—10+ ratings, 100+ downloads (for Android), and/or 10+ downloads for Chrome—has plummeted.
In other words, yes, the data suggests that App-Slop is the story, for now. AI has led to a lot more apps, but they are not successful apps, in any meaningful sense.
That’s not really surprising. Building successful apps (or software) has always been more than just generating the code. Plus, it’s still very early, and one would expect that all the amateur tinkering would produce supply ahead of demand.
For what it’s worth, SensorTower’s data corroborates the story, for the most part. In the US, total app revenue has been basically flat since the beginning of last year, with a modest increase in total time-spent:
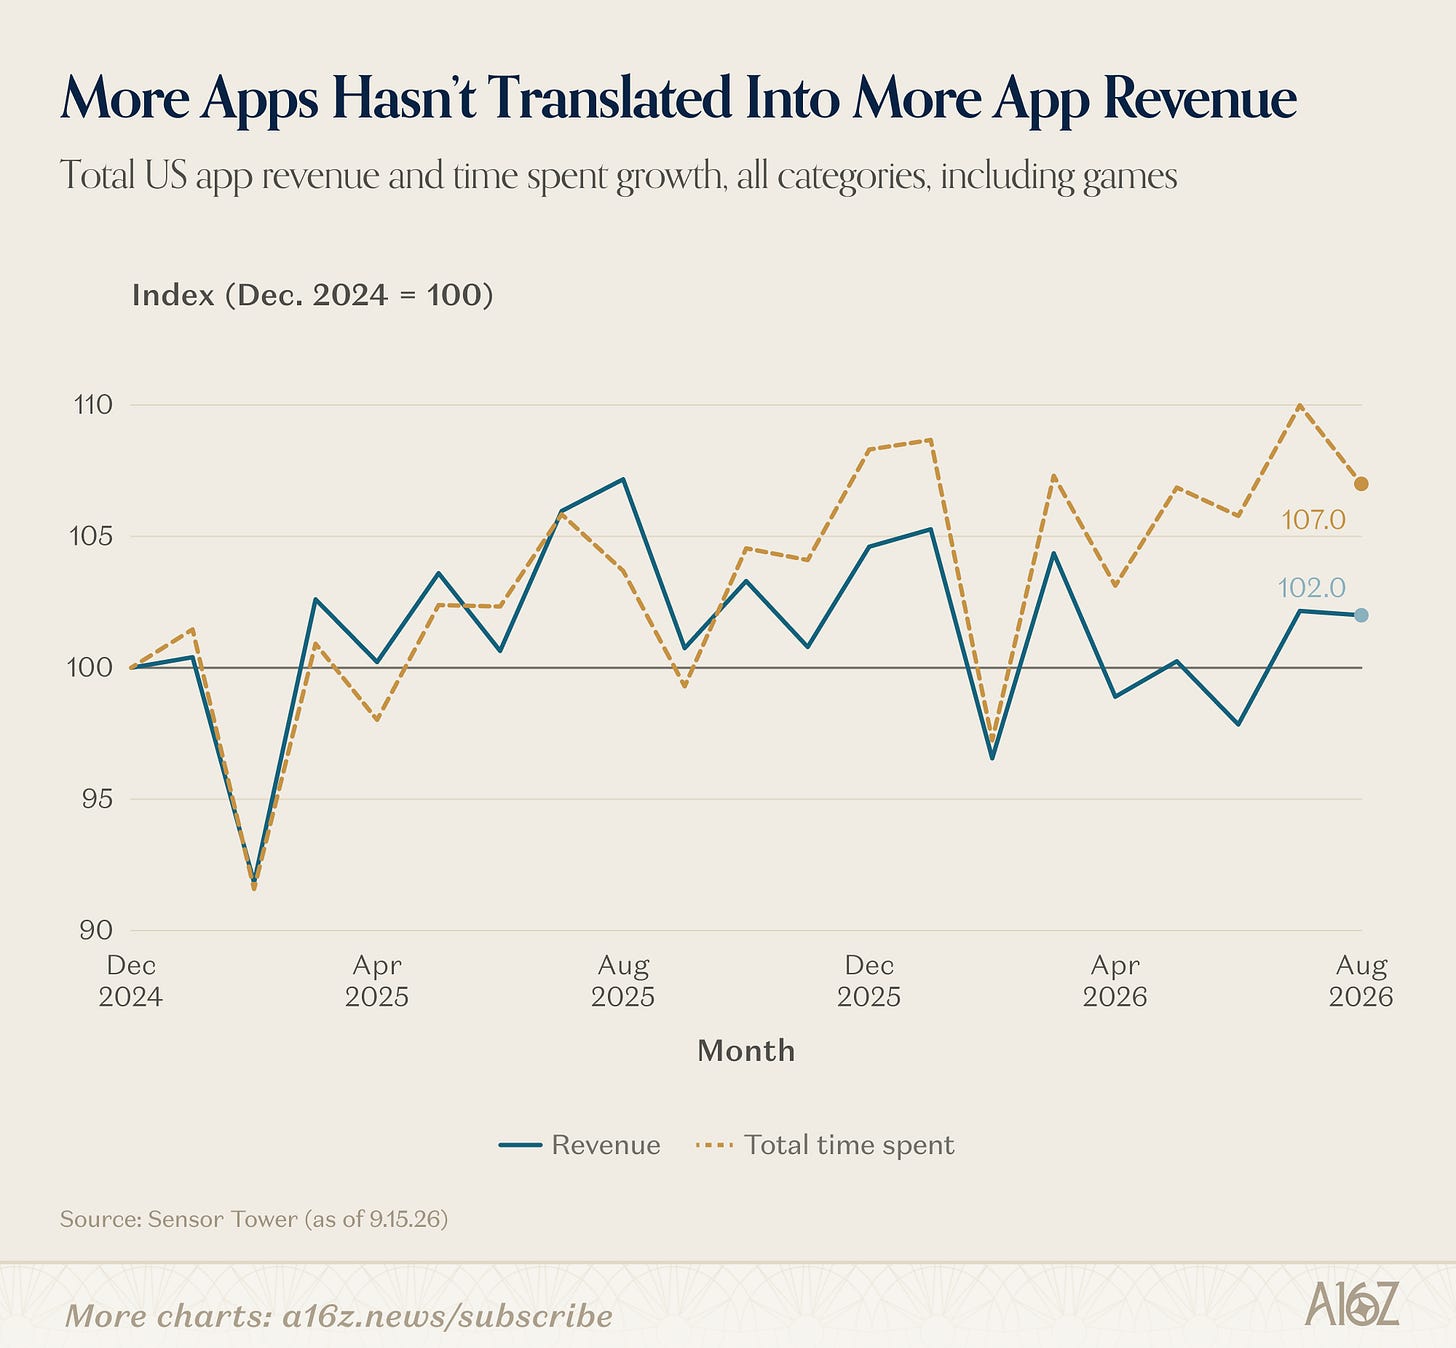
SensorTower’s estimates indicate a ~2% increase in app revenues, and a 7% increase in usage time, over the past year and a half. Once again, more apps has not led to a boom in the app economy.
Beneath the surface, however, it is nonetheless clear that AI is making a difference:
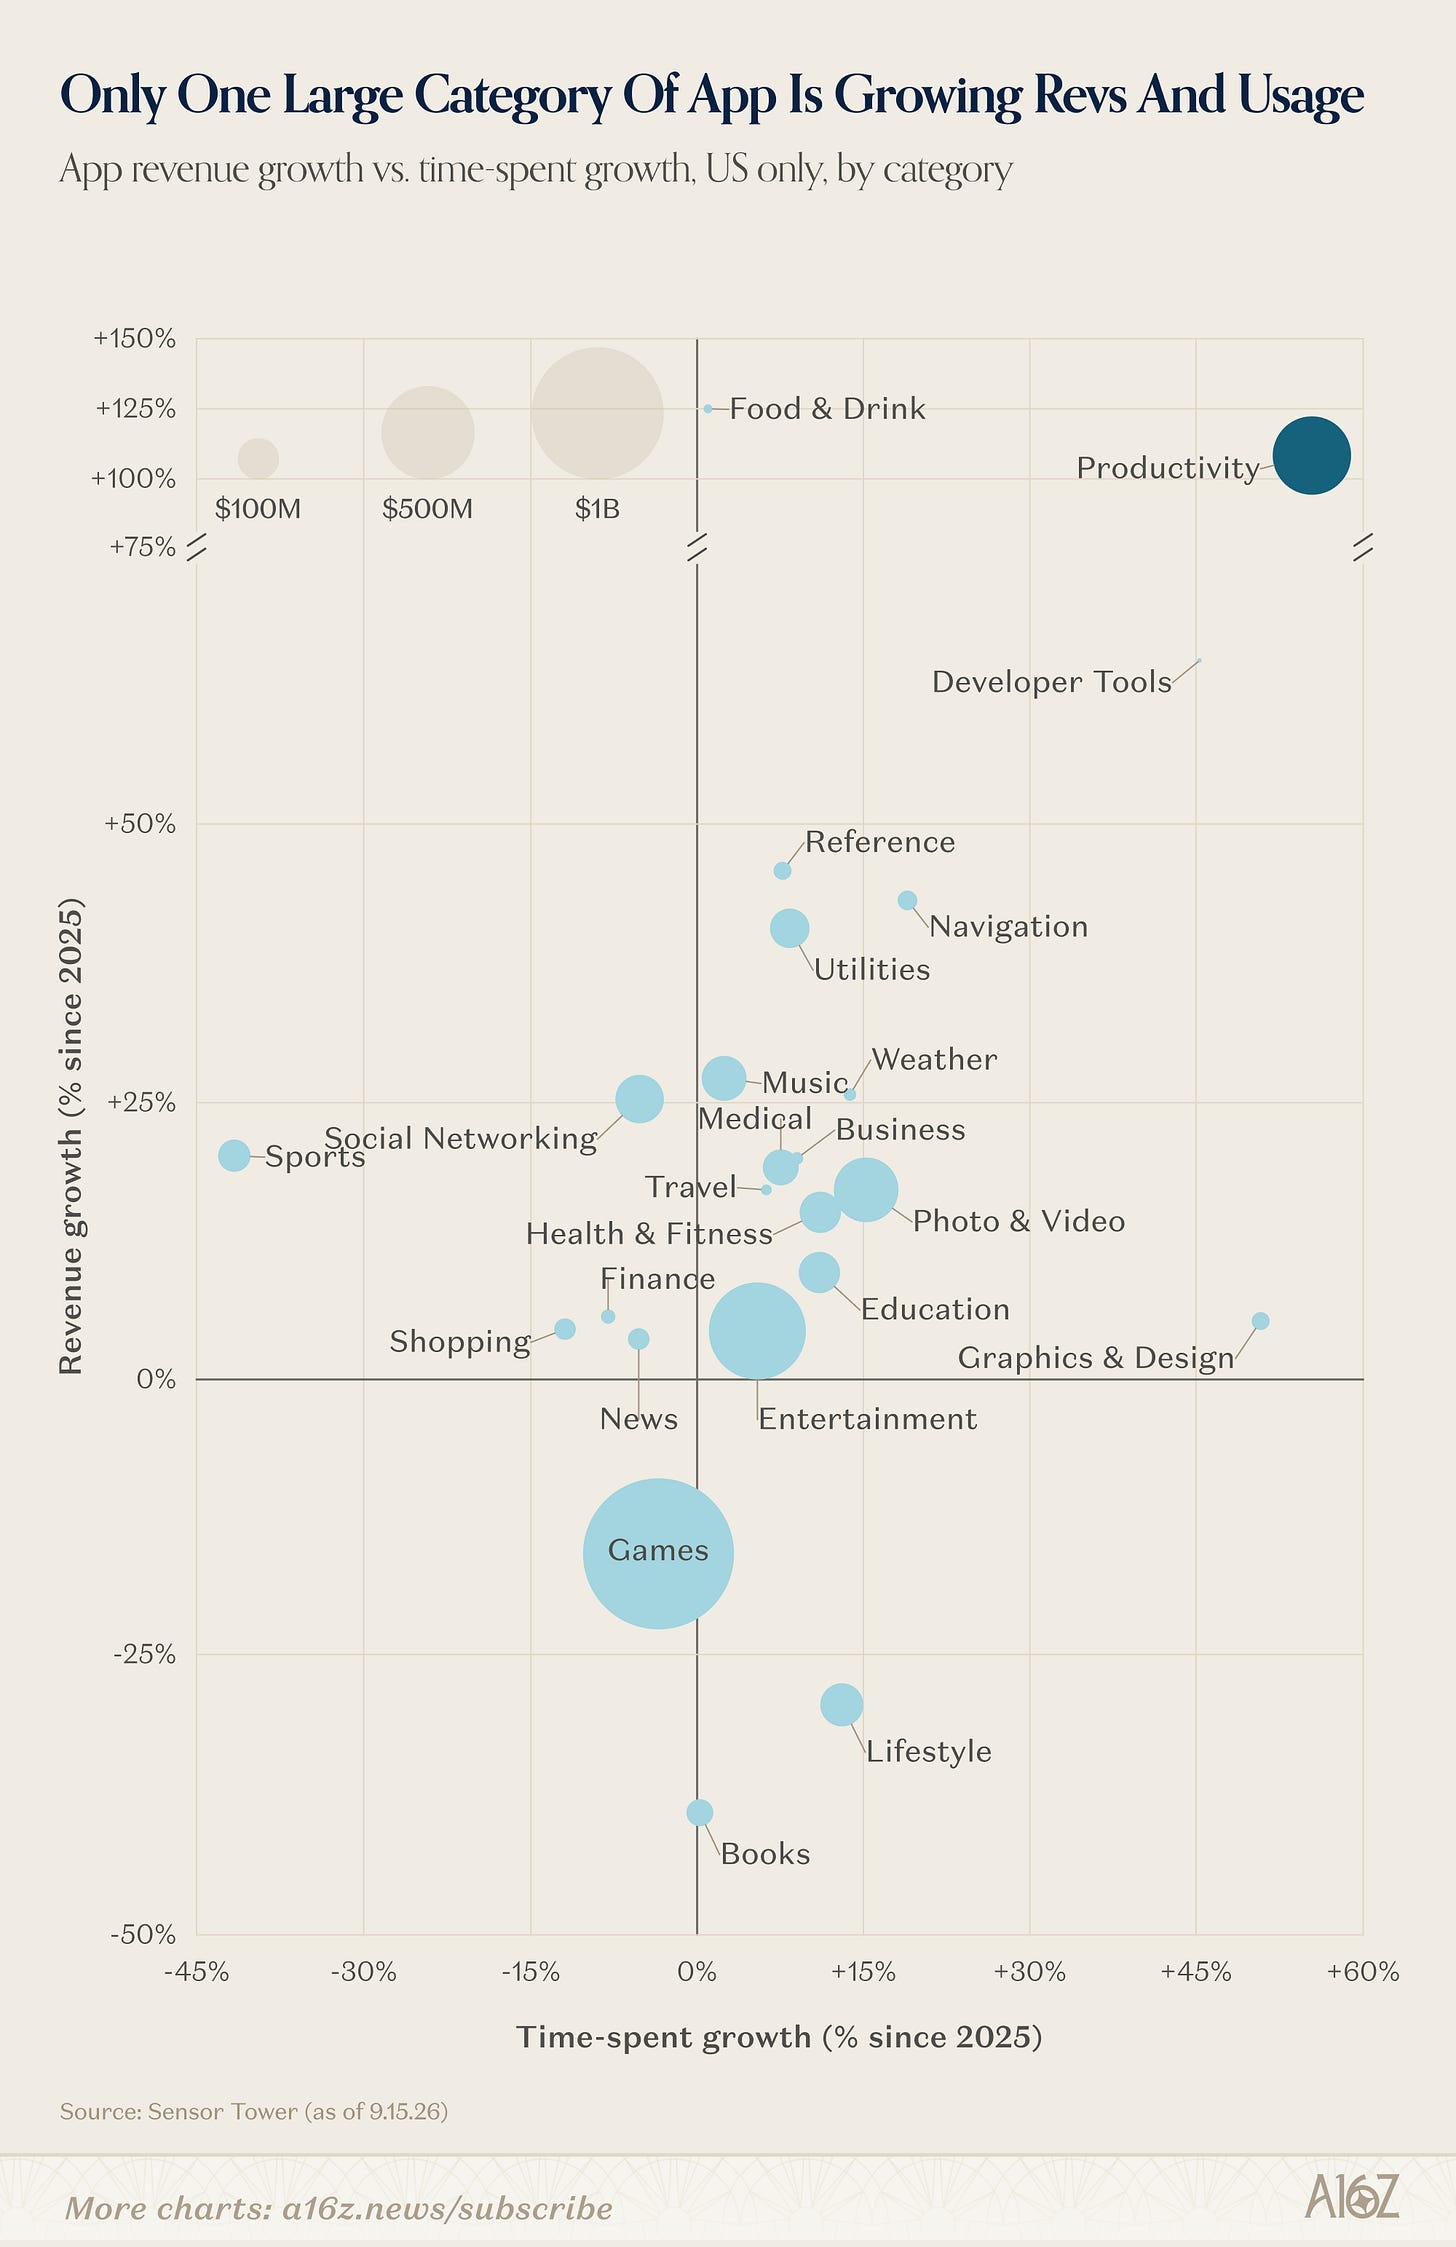
The category with the fastest growing time-spent (and the second fastest growing revenue, after the relatively tiny Food & Drink category) is Productivity, driven by none other than ChatGPT, Claude, Gemini and Grok. Another standout category, albeit a tiny one, is Dev Tools, where Replit is by far the category leader for growth.
AI apps are plainly very popular, but the apps made by AI, not so much.
Consider this one small footnote in the broader question of “when will AI adoption show up in GDP?” (and the answer, in this case, is when the apps get much better).
In the bigger scheme of things, paid consumer AI adoption remains quite low, even as it grows:
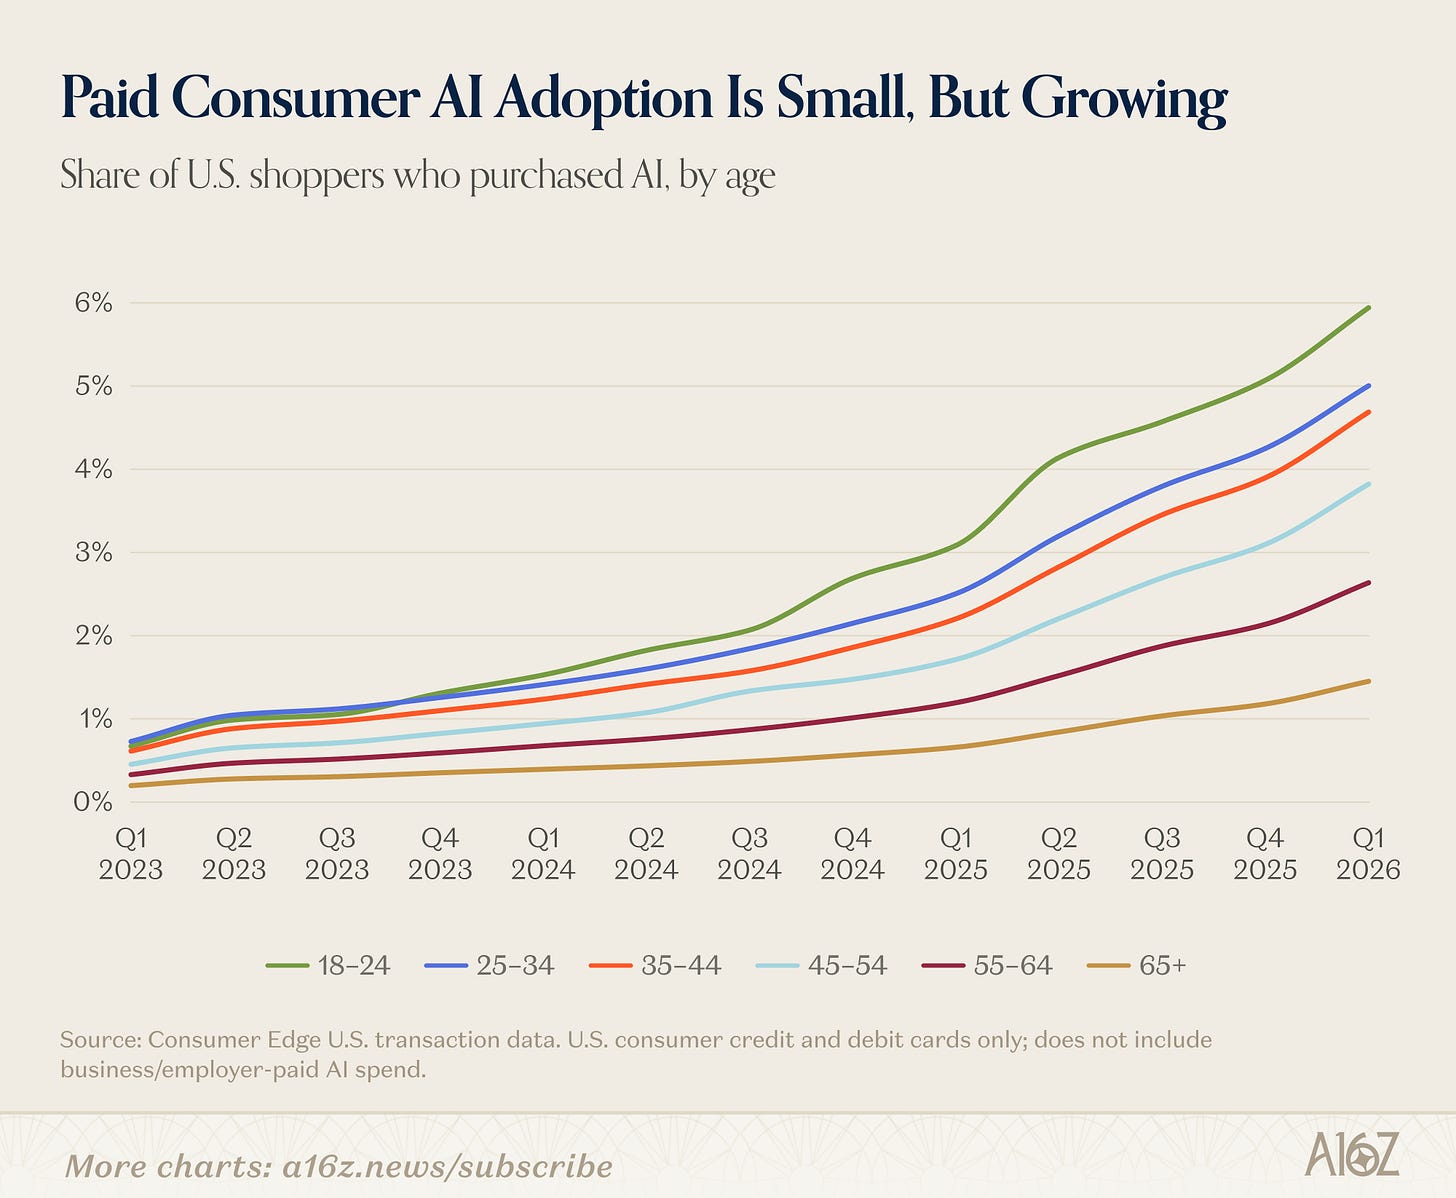
Consumer Edge indicates that, as of Q1, paid consumer AI adoption was around ~3%, with younger folks out-adopting older folks by ~4x.
So, yes, as cringey as it is to say, it’s nonetheless true: we’re still so early.
On the subject of AI’s early ripple effects through the economy, one area where they are clearly visible is in the landscape for venture-backed companies.
Not only is AI driving historically large value creation in a historically small share of companies, there’s some data to suggest that AI is minting an entirely new breed of unicorn—one that is younger, and faster-growing than before.
According to data from SVB, while the entire universe of venture-backed $1B+ companies has gotten steadily older, the recent vintage has gotten progressively younger:
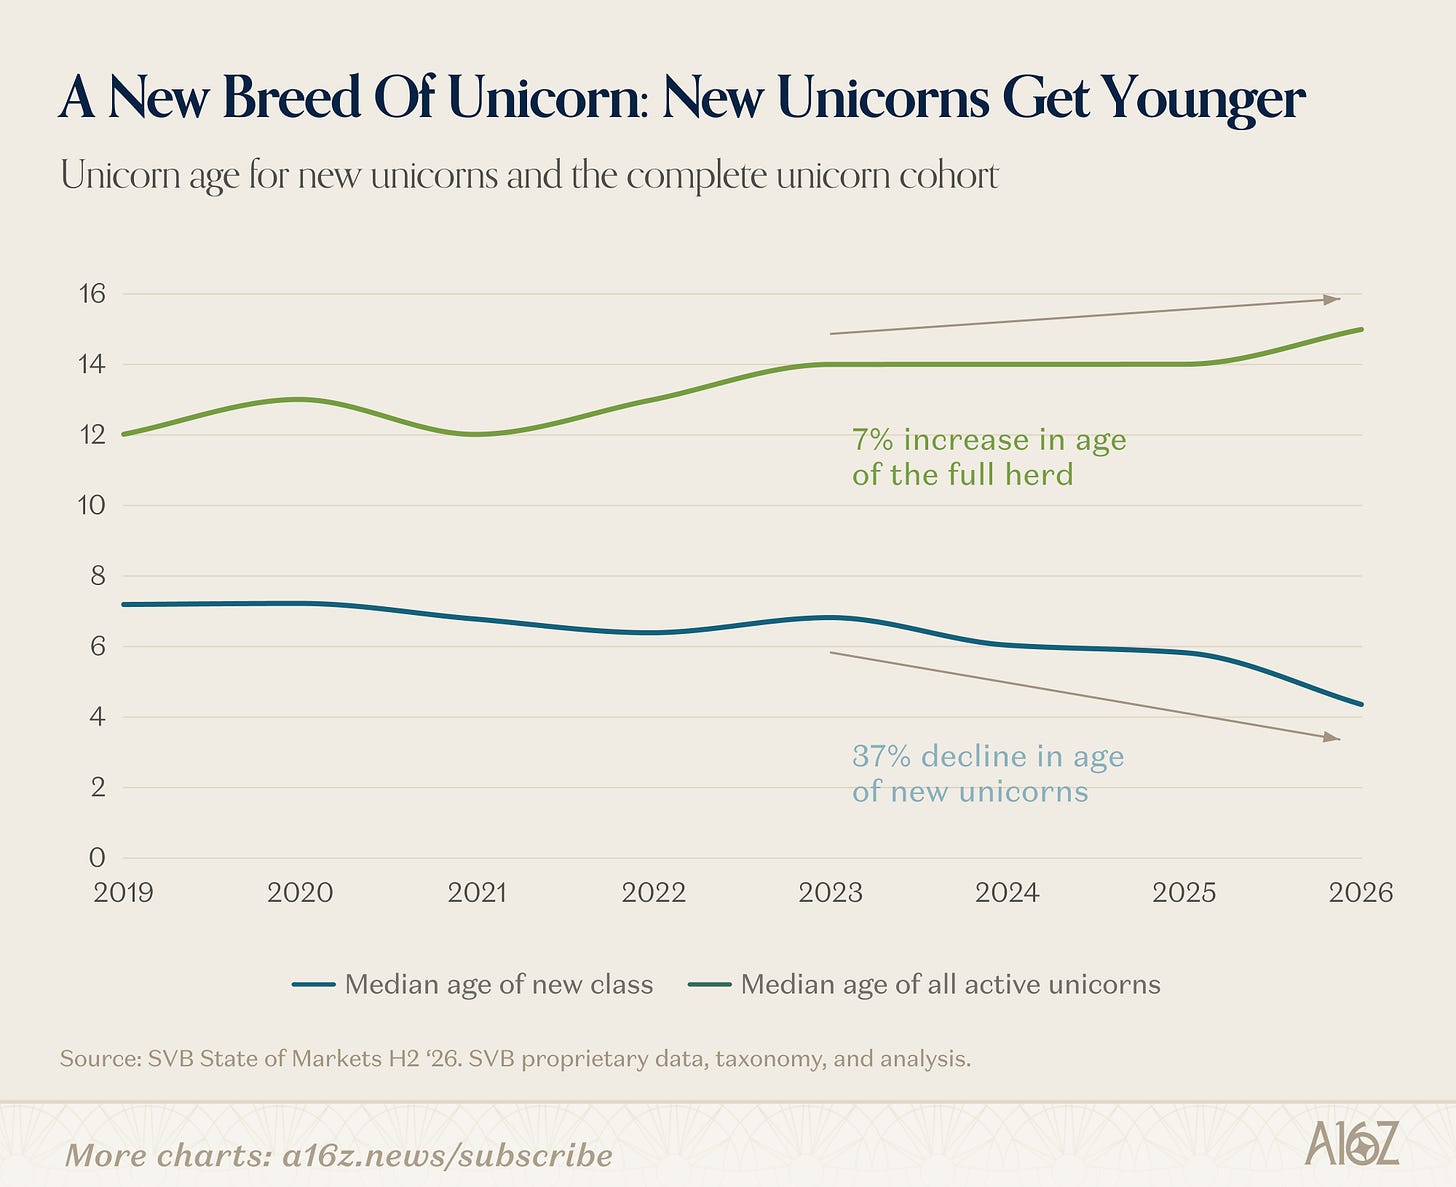
The “full herd” has gotten ~7% older, but the median age for new unicorns is now just a shade over 4 years, reflecting a 37% decline since 2023.
It’s not just that unicorns are being minted earlier in their lifecycle than before. Across all the companies in SVB’s data, medianrevenue growth for the post-GPT generation is operating on a noticeably different curve:
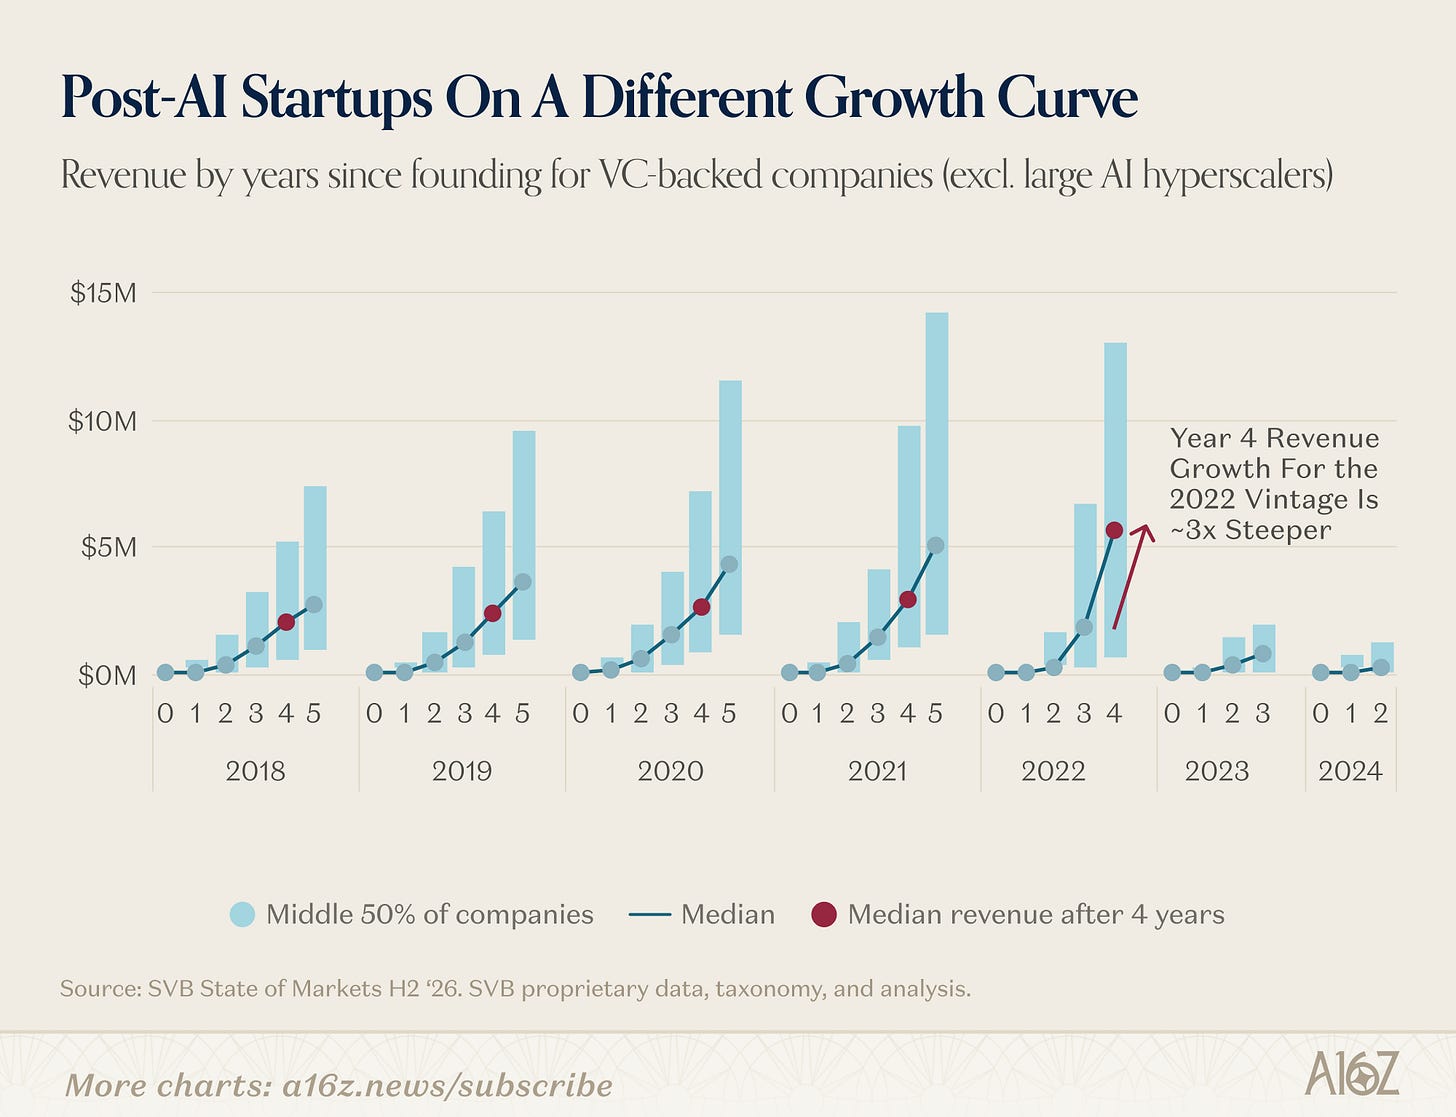
For the 2022 cohort, the revenue jump from year 3 to 4 at the median is ~3x larger than earlier cohorts. Put another way, instead of going from $2M to $3M (as per the pre-GPT cohorts), the ‘22 batch went from $2.8M all the way to $5.6M.
Is that AI? It’s possible, but we’ll have to wait a bit to see if the ‘23 and ‘24 batches follow a similar trend.
Truthfully, the reality is a bit more complicated. AI has changed the venture landscape, but one feature of that shift has been greater allocations to non-software businesses, which one would expect to have very different growth curves. By contrast, one could easily imagine that the ‘22 batch is full of fast-growing “AI wrappers” that may or may not be able to keep it up.
Growth-curves aside, it is undoubtedly the case that AI has changed the game for pre-AI techcos. For one thing, the combination of AI-driven shift in VC strategy plus higher interest rates has led to a noticeable change in operating priorities: beginning in Q1’22, techcos in all verticals tracked by SVB, began trading growth for profitability:
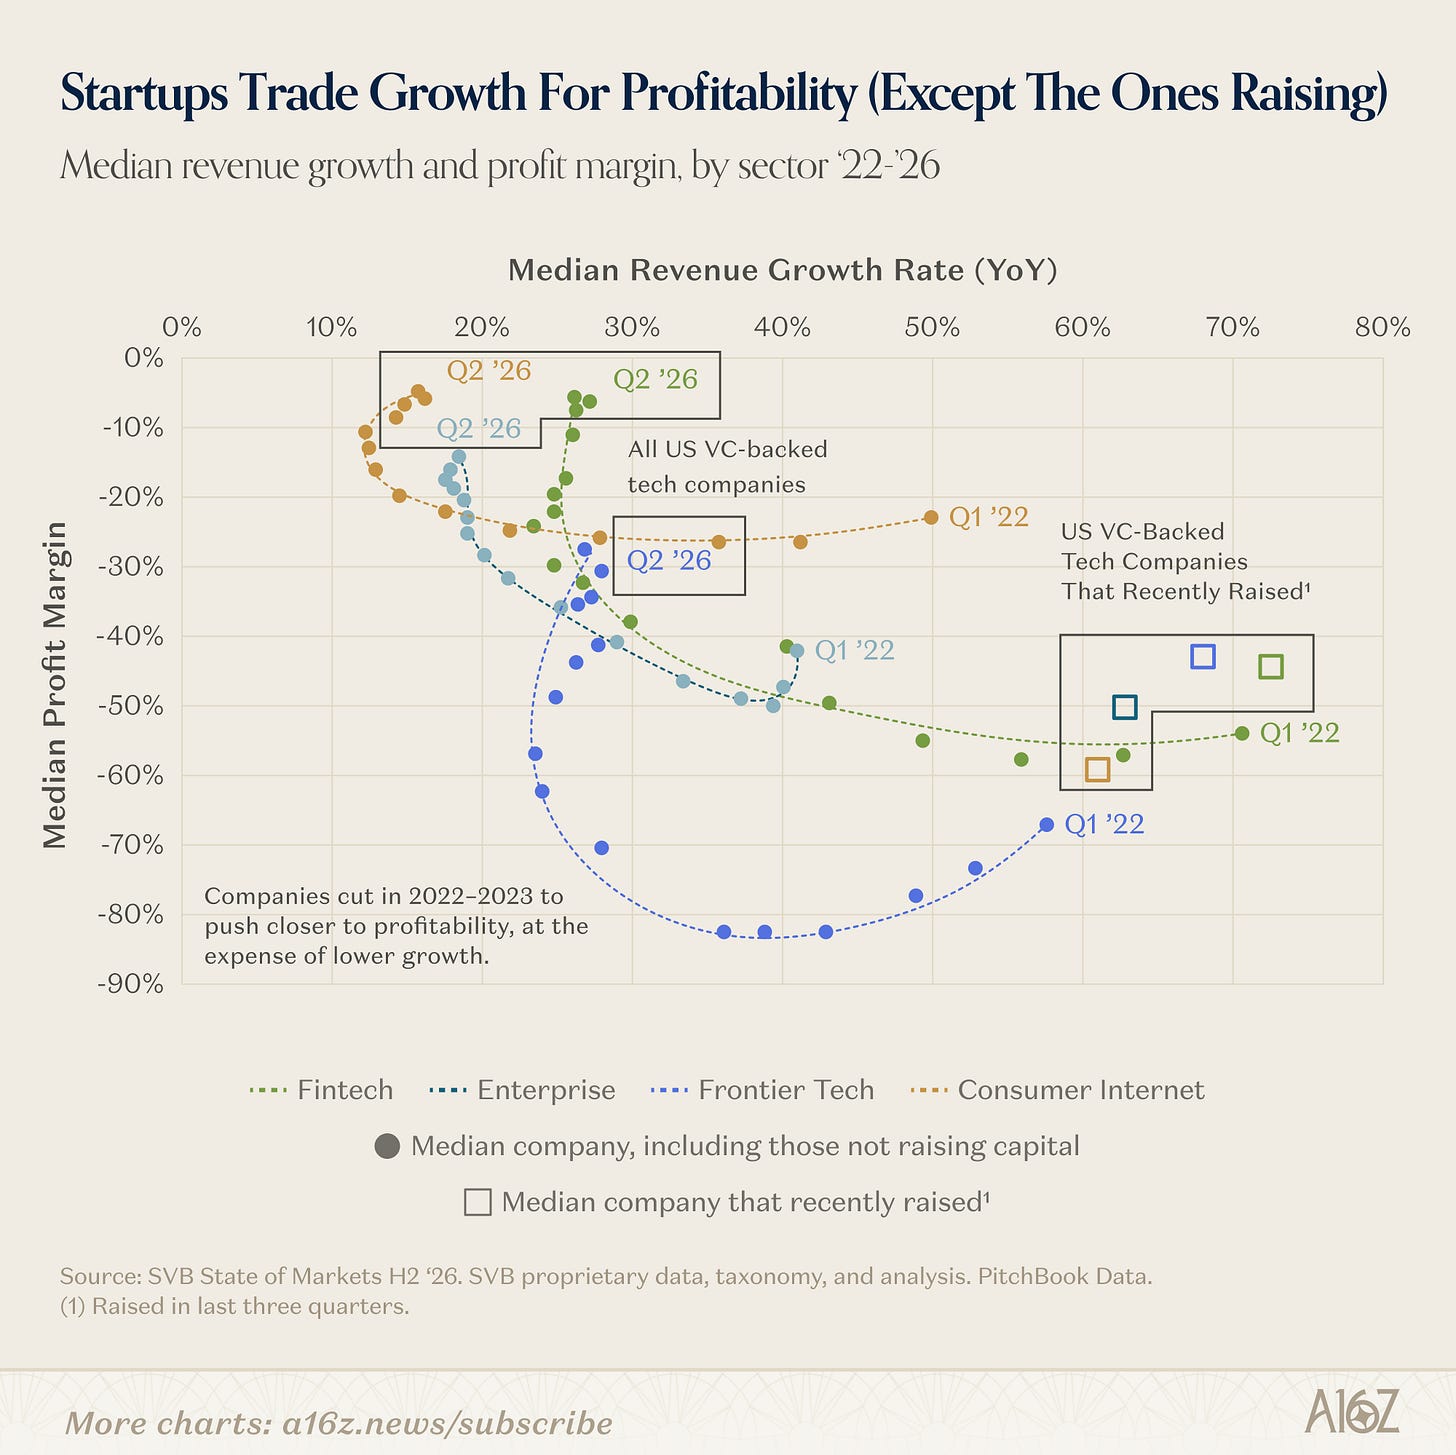
Growth went from 40%-70% at the median all the way down to 15%-30%, while margins did the opposite, running from deeply unprofitable to nearly breakeven. By contrast, the companies getting funded most recently have growth/profitability profiles not unlike the ‘22 standard.
Now, to be fair, ‘22 was something of a pandemic-reopening-ZIRP high watermark for growth, and then later, when interest rates went up, everyone battened down the hatches—public companies traded growth for profitability, too. Plus, growth does appear to have reaccelerated recently.
That all being said, companies minted during the previous cycle are confronting a decidedly new-normal. An historic number of businesses were founded, and now an historic number of businesses are shutting down:
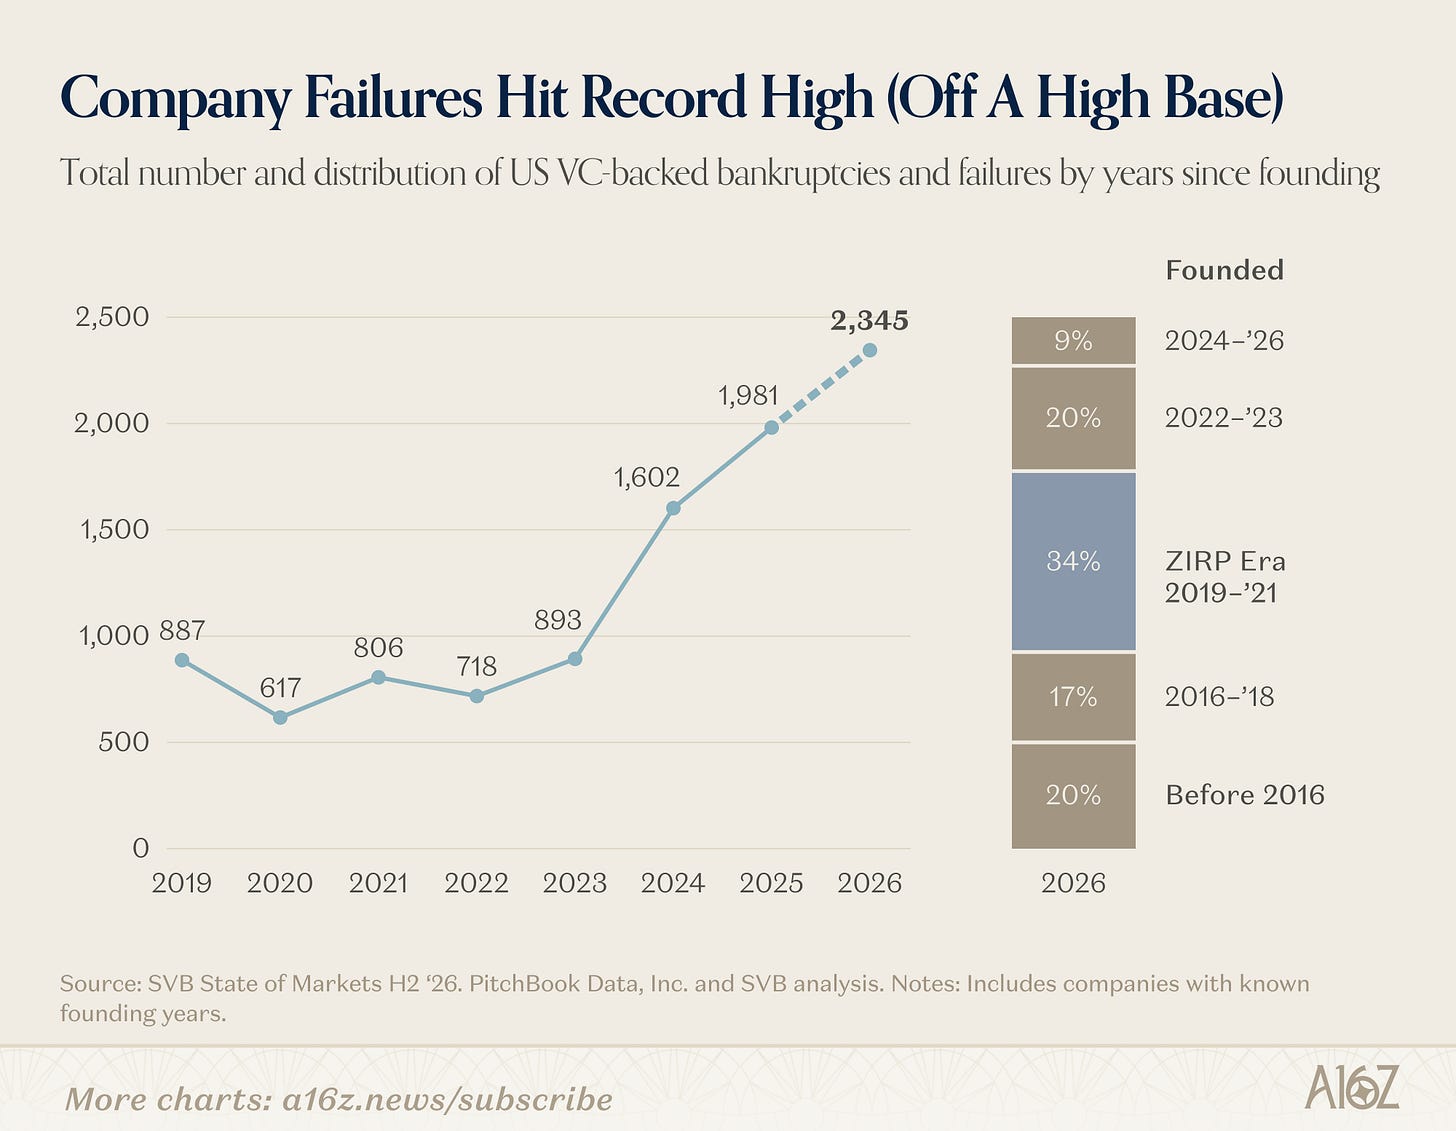
Unsurprisingly, the largest share of shutdowns comes from the peak-ZIRP vintages.
Likewise, SaaSpocalypse appears to have hit startup land, as well:
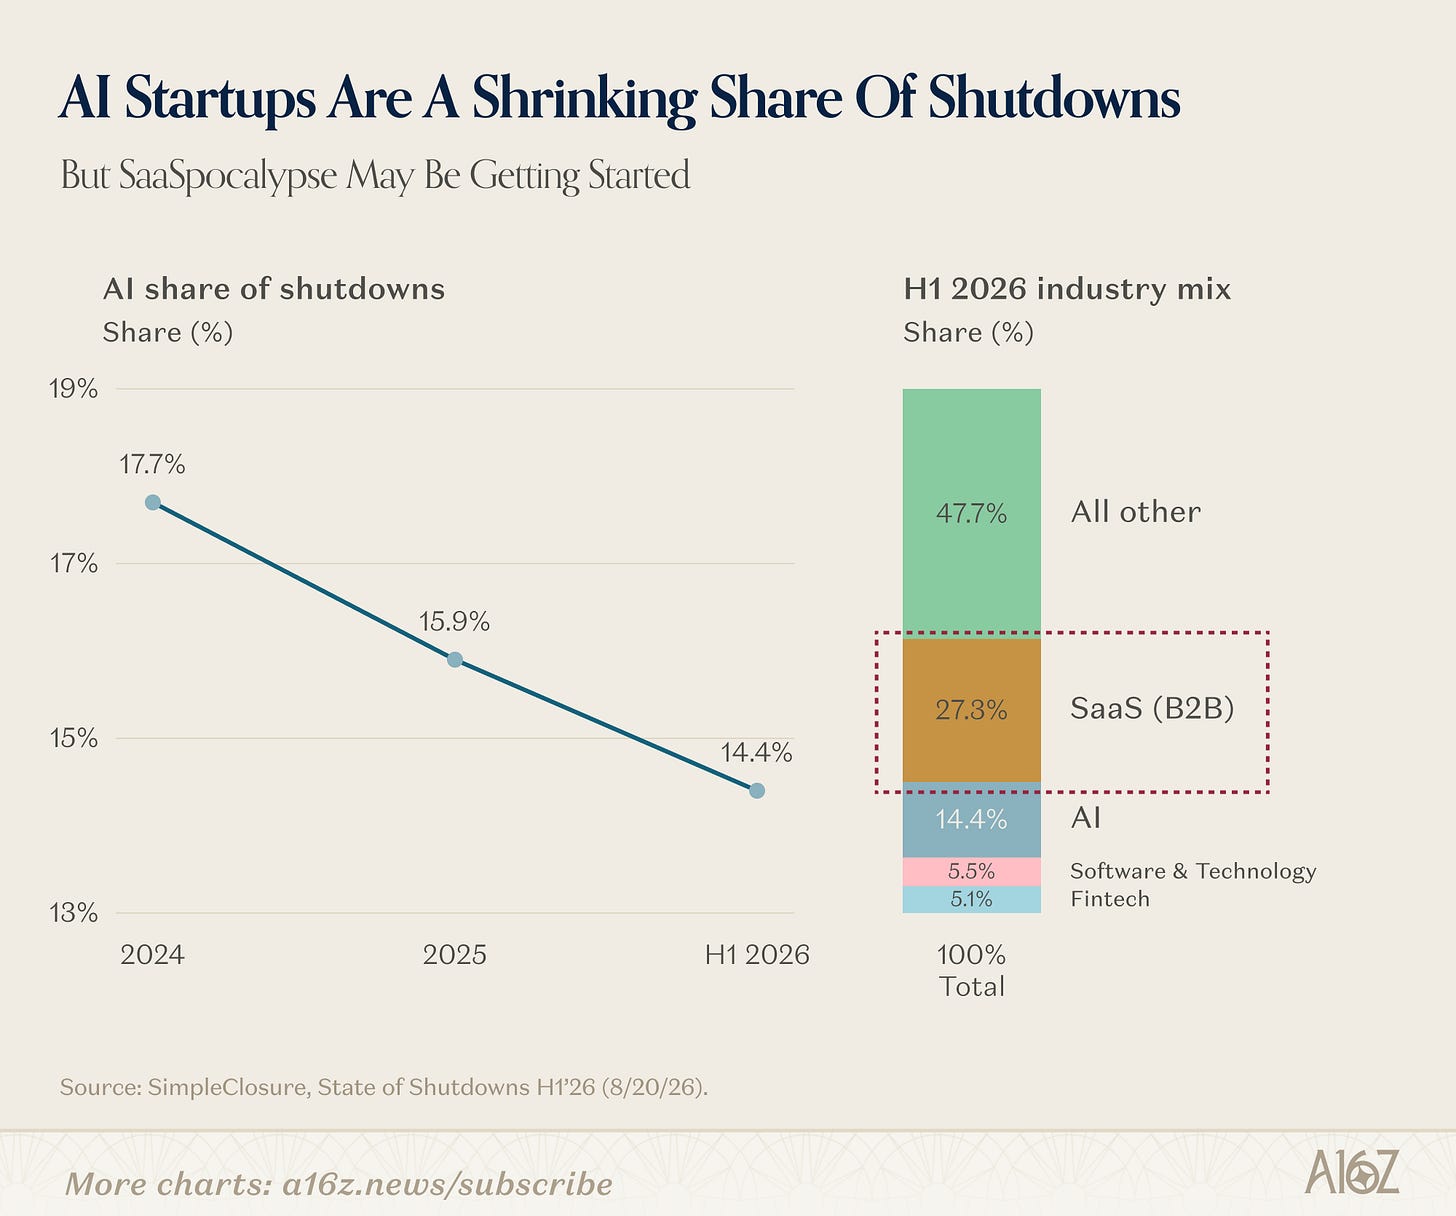
According to data from SimpleClosure, while AI startups are an increasingly small share of shutdowns, B2B SaaS represents more than a quarter of H1 ‘26 shutdowns.
Again, the denominator was high—B2B SaaS was a very popular category—and, beyond that, it’s hard to say how much of this is AI-driven disruption vs. a shift in thematic winds, but either way, the new cycle is not like the old cycle, and that’s not fun for everyone.
Speaking of SaaSpocalypse, here’s a fun one. Remember that Citrini doompost that foretold the end of software (and pretty much everything)?
Well, for now at least, Citrini seems to have ticked the bottom of the software selloff:
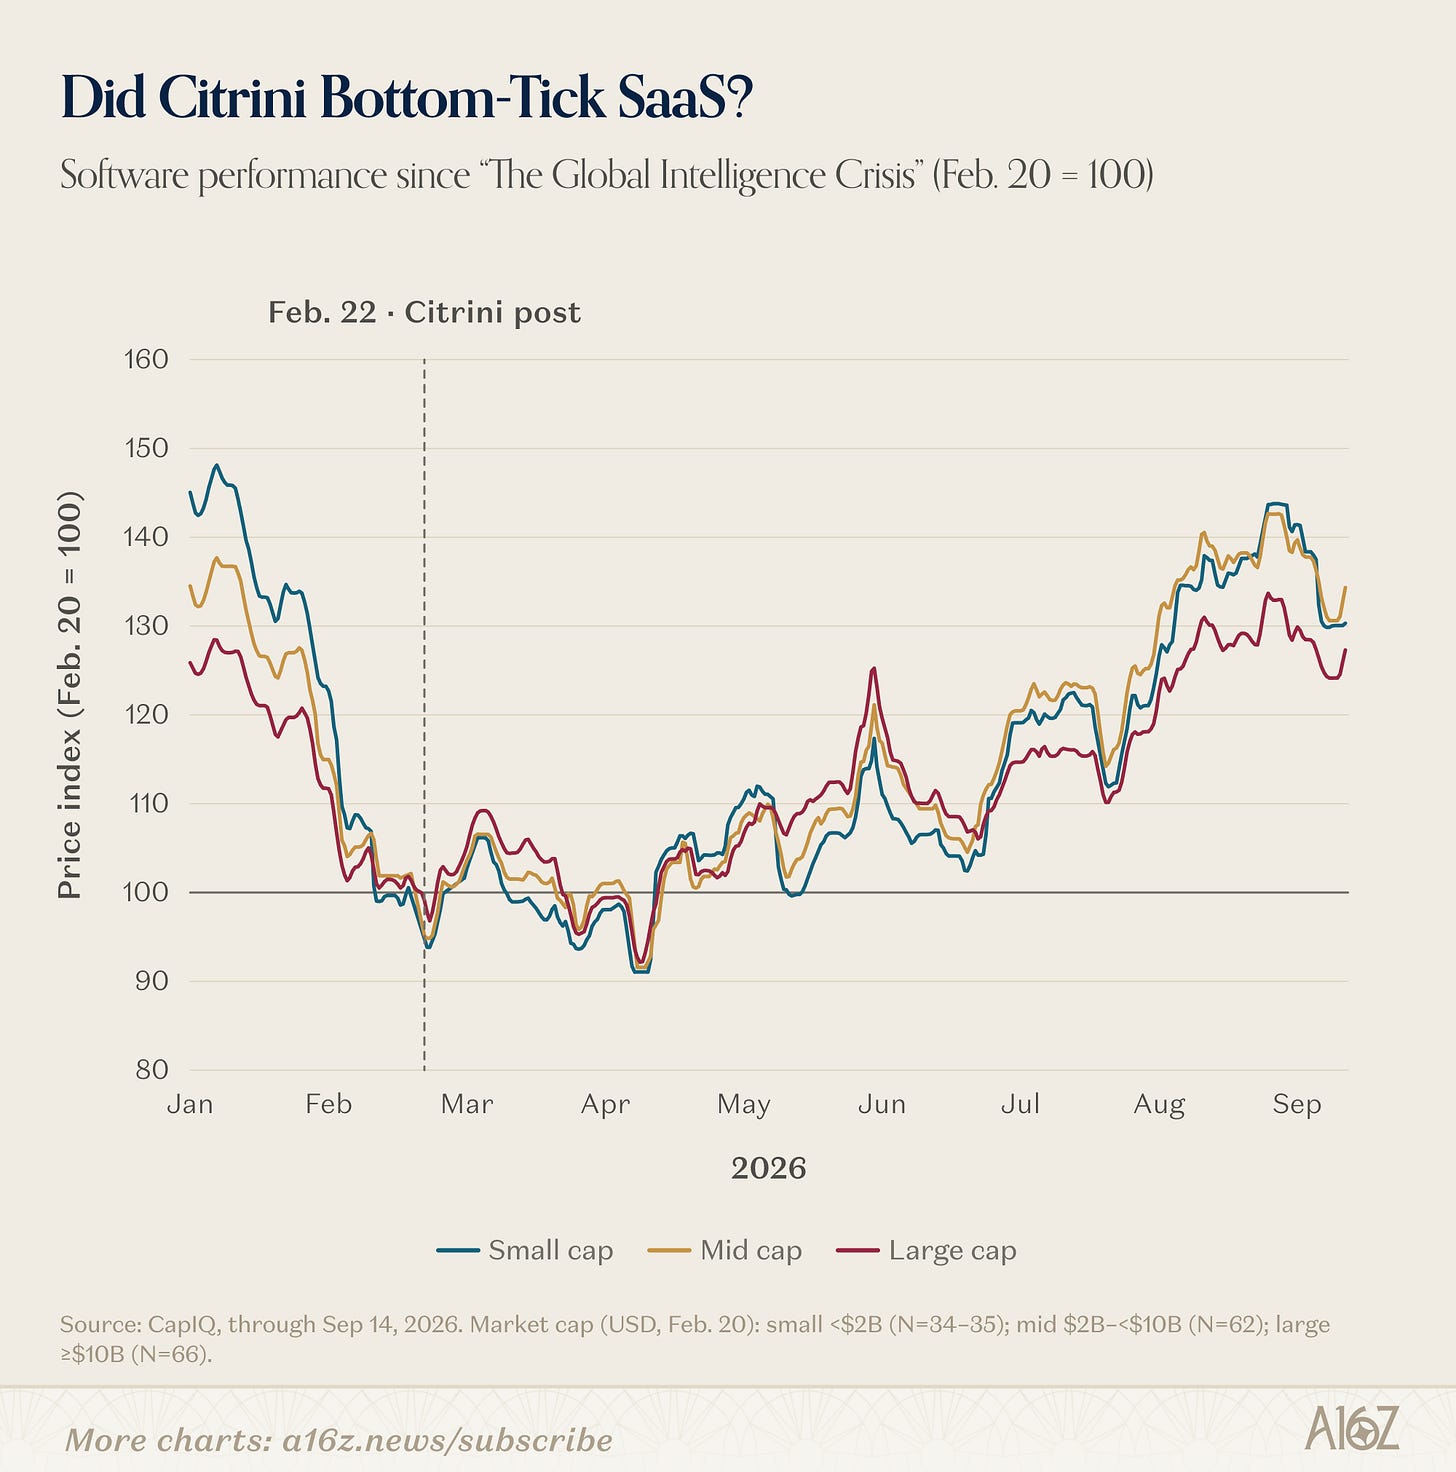
Software performance for all companies big and small has climbed unsteadily upwards since April . . . so Citrini didn’t quite tick the bottom, but came awfully close (at least for now).
Charts has gone over software’s selective selloff a few times, so no need to rehash it all here, but suffice it to say that fundamental performance for SaaS has more or less held up. That doesn’t mean it will continue to hold up, of course, but a rough summary of the headlines shows that software companies have generally beat or met expectations for the first half of the year:
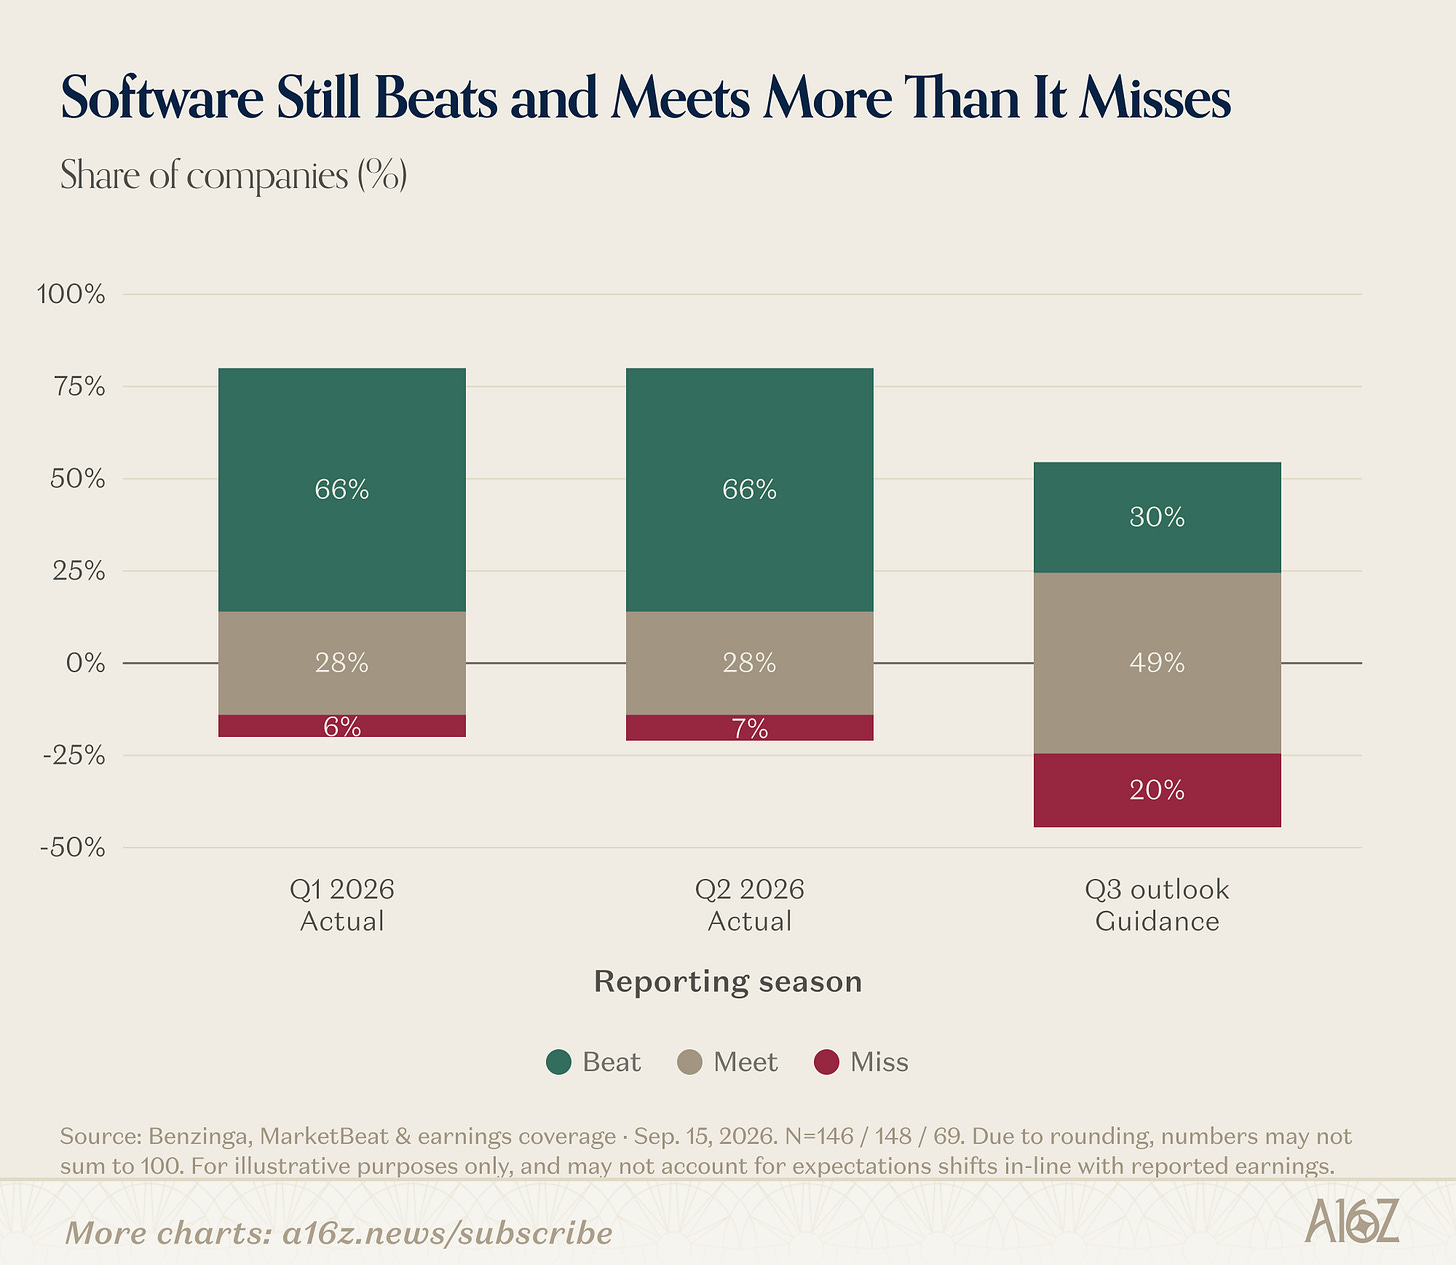
Notably, the share of software companies with disappointing guidance increased in the most recent quarter, but meet or beat was still the predominant story.
Take this data with a grain of salt because it’s not comprehensive, and it says nothing about actual performance—it’s of course easy to exceed low expectations, and similarly easy to disappoint high expectations, but in both cases, actual performance can be variously strong or weak. In all events, whatever SaaSpocalypse may be in the offing, it hasn’t arrived yet.
Apropos of nothing (except a passing interest in jurisdictional competition for startups), it turns out that there is a very not-normal distribution of startup costs, by state:
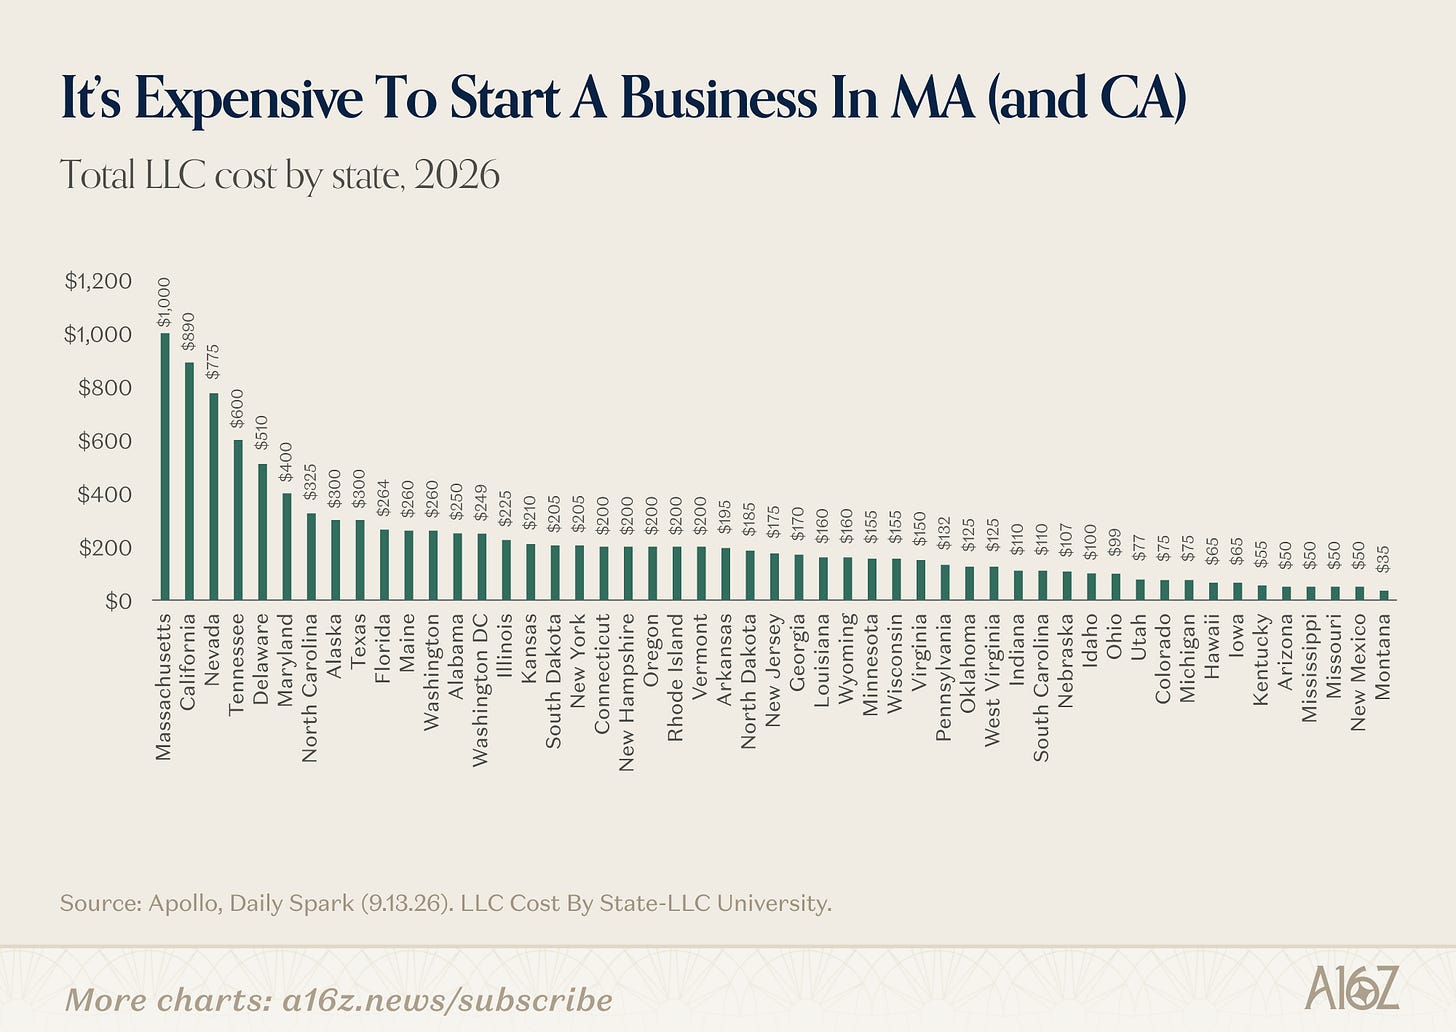
LLC costs in Massachusetts run ~$1,000, or ~5x the nationwide median.
To be fair, $1,000 is a rounding error in the big scheme of business costs, but these things do add up, and may be symptomatic of a broader policy posture. MA was ranked 49th in the nation for the cost of doing business, and despite having some of the best research institutions in the world (and some of the best talent), Massachusetts has been hemorrhaging businesses over the last few years:
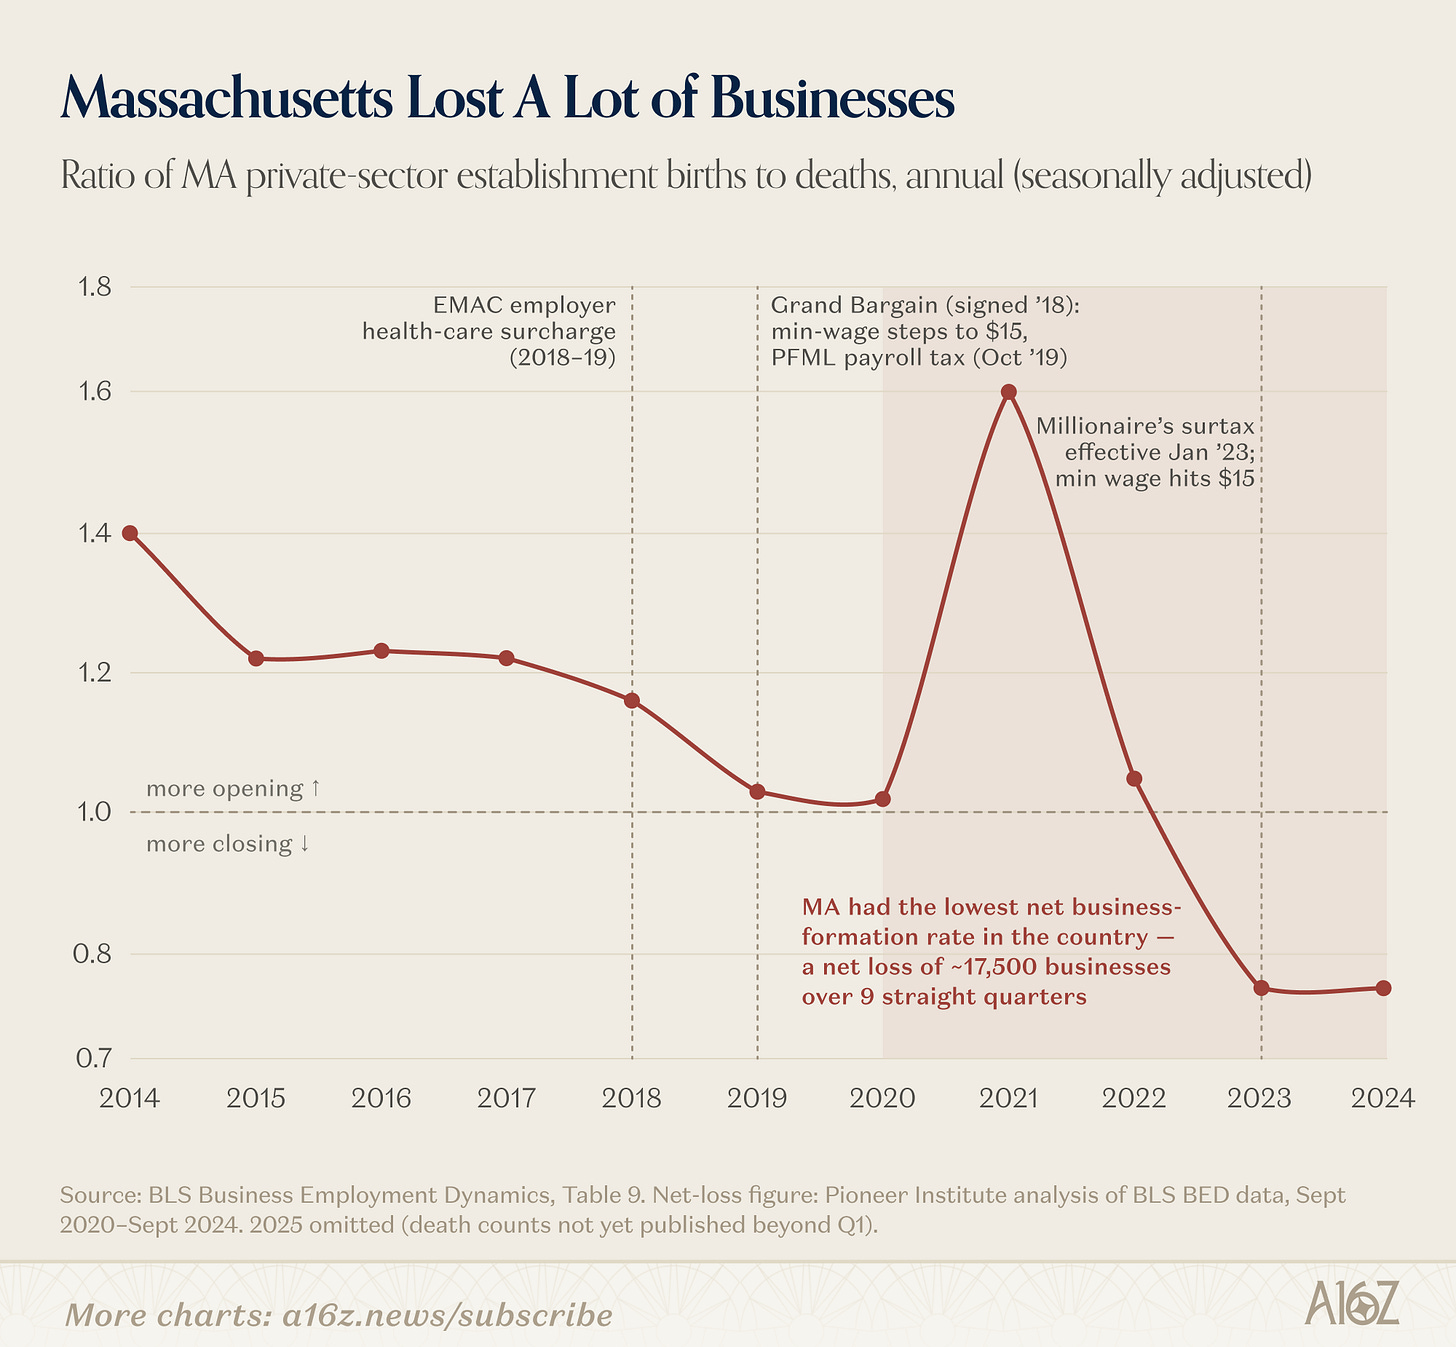
Net business formation has been trending downwards since 2017, and has been sharply negative since the pandemic reopening, leading to the worst ratio in the country.
Approximately 17,500 MA businesses were lost (on net) over a 9-quarter period. To be fair, the data lags (because a business has to report four quarters of zero employees to be considered a “death”), so it’s possible things have improved . . . but for now, it seems that Massachusetts is a pretty unfriendly place to open up shop.


This newsletter is provided for informational purposes only, and should not be relied upon as legal, business, investment, or tax advice. Furthermore, this content is not investment advice, nor is it intended for use by any investors or prospective investors in any a16z funds. This newsletter may link to other websites or contain other information obtained from third-party sources - a16z has not independently verified nor makes any representations about the current or enduring accuracy of such information. If this content includes third-party advertisements, a16z has not reviewed such advertisements and does not endorse any advertising content or related companies contained therein. Any investments or portfolio companies mentioned, referred to, or described are not representative of all investments in vehicles managed by a16z; visit https://a16z.com/investment-list/ for a full list of investments. Other important information can be found at a16z.com/disclosures. You’re receiving this newsletter since you opted in earlier; if you would like to opt out of future newsletters you may unsubscribe immediately.
No posts