
AI 引发招聘变局:经验为什么更受重视?
从招聘要求的变化,理解经验的价值与适用边界;同时读懂注意力、安全和建设需求的三组信号。
- 技术岗位的经验要求上升、技能条目减少,提示企业可能更重视能在工作方法变化时作出判断的人。
- 经验的价值在于能否转化为方案选择、排错和结果检验;履历年限本身无法证明这些能力。
- AI造成招聘变化仍是解释假说;当新工作逐渐定型,企业也可能重新提高对具体技能的要求。
风险投资机构 a16z 旗下媒体的最新一期图表周报,把一个招聘变化放在了标题里:科技企业对工作经验的要求在提高,对技能清单长度的要求却在下降。作者 Moses Sternstein 借此提出一个值得讨论的解释:当新技术让工作方法不断变化时,企业更需要能判断问题、找到办法的人。
招聘之外,这期周报还讨论了三个独立话题:
- Netflix 的注意力竞争:用户把时间花在哪里,如何影响流媒体平台的竞争位置?
- 网络安全的响应速度:漏洞更早遭到利用,企业还能留下多少修复时间?
- 数据中心的用工需求:AI 基础设施建设,怎样带动建筑业和专业工种就业?
经验要求上升,不等于技能已经不重要
Revelio Labs 的招聘数据出现了两条方向相反的线:从 2025 年初起,技术岗位要求的经验年数上升,列出的技能数量下降。图中已控制岗位资历层级,值得关注的是同类岗位的要求如何变化。
同类技术岗位:经验要求升,技能条目降

2025年起两条线明显分离;红线读左轴的技能数量,蓝线读右轴的经验年数。已控制岗位资历层级。两线交点不表示数值相等。
数据与系统相关技能,经验要求增幅靠前

比较自2023年以来,每次技能提及对应的经验年数增量;数据组织与数据研究位列前二。
这里的“经验溢价”衡量招聘要求,不能直接读成薪资涨幅。招聘广告也只能告诉我们企业怎样描述理想人选,无法单独证明最终录用了谁、什么能力带来了更好业绩。
如果企业少列几个技能关键词,却多要求一些经验,它在试图筛选什么?
工作方法还没定型,判断能力就更难写进清单
技能清单适合描述明确的工作:使用什么工具、完成什么任务、达到什么标准。当工作本身尚在变化时,清单就不容易覆盖真正的难点。人可能熟悉列出的工具,却仍不知道先处理哪个问题,或怎样判断结果是否可靠。
Sternstein 的解释是,AI 让既有做法的适用性发生变化,而新做法还没有完全定型。此时,经历过复杂问题的人,可能更善于在条件不完整时推进工作。数据和系统相关岗位的经验要求变化,是他支持这一解释的线索。
具体看数据工作:AI 增加了整理和处理数据的迫切性,但需要整理成什么形态、处理流程怎样安排,都在变化,最优方案也没有固定下来。Sternstein 的推论是,连任务该怎样完成都还在摸索时,企业很难先列出一张准确的技能清单;能边做边判断的人,因此更有价值。这解释了为什么经验要求增幅靠前的项目集中在数据组织、数据研究、系统架构等领域。
- 工作方法在变化旧方法未必适用
- 技能清单难覆盖任务尚未完全定型
- 判断能力更受重视经验提供筛选线索
这条路径解释招聘偏好,尚不能证明AI造成了图中的变化。
这个判断有一个关键限定:有价值的经验,需要能转化为新的判断。 单纯重复同一种操作,与经历过方案选择、失败排查和结果检验,并不意味着同样的能力。履历年限容易统计,判断质量却需要通过具体工作才能看见。
对求职者而言,可以把项目经历整理成一条可检验的链:遇到了什么约束,为什么选这个方案,出现了什么偏差,怎样确认修正有效。这是一种展示能力的方法,并不保证招聘结果;它的作用是让“我有经验”变成别人能够判断的证据。
AI 是否造成了招聘变化,目前仍是解释假说。岗位结构、远程招聘范围和从业者自然年龄增长,都可能影响观察结果。等到新工作形成稳定方法,企业也可能重新把这些能力写成具体技能要求。原文标题中的大于号,适合描述一种阶段性的偏好,不能理解为经验永远压过技能。
Netflix 的压力,要把使用量、份额和收入分开看
应用数据机构 Apptopia 观察到,美国社交媒体使用时间仍在微增,增长主要由 17—25 岁用户推动;36 岁以上用户的使用时间自 2025 年 10 月起趋于回落。与此同时,自 2026 年 4 月以来,社交媒体占手机总使用时间的份额下降约 3 个百分点。用户仍在刷社交媒体,却把更多新增时间给了别处。
美国社交应用总时长上升,年龄组走势有别

总量仍高于2023年,17—25岁组继续增加;其他年龄组近期出现走平或回落。
手机时间份额回落,同比增速接近零

深绿线读右轴的手机时间份额,浅绿线读左轴的同比增速;接近零的是增速。
使用时间增加,份额仍可能下降。假设某类应用从每天 40 分钟增至 45 分钟,而手机总使用时间从 100 分钟增至 125 分钟,它的份额就从 40% 降至 36%。这个假设例子说明,绝对增长不能直接证明竞争位置改善。Sternstein 提出了其他应用、AI 和短视频等可能去向,并更倾向于 YouTube 短视频带来的竞争;这些去向仍是解释,份额变化本身没有识别出原因。
交叉使用出现不对称:YouTube用户更少打开Netflix

美国移动应用指数,以2025年1月为100;Netflix用户使用YouTube的指数大致稳定,反方向明显下降。
美国周活跃用户:Netflix走低,Spotify走高

以2022年12月26日所在周为100;这是各自的变化指数,不能用来比较两者用户总量。
美国使用时长:Netflix下降更明显

以2023年1月为100;Netflix降至约70附近,Spotify仍高于基期。
Netflix 面对的是更直接的压力:YouTube 用户中同时使用 Netflix 的那条指数下行,而 Netflix 用户同时使用 YouTube 的指数大体平稳。Sensor Tower 的美国数据还显示,Netflix 的周活跃用户与使用时长长期趋弱。以图中各自的 2022 年末、2023 年初起点为 100,最新周活跃用户指数在 80 多,使用时长指数约为 70,观看时间损失得更明显。短视频竞争是可能的解释,订阅价格和其他流媒体竞争也可能参与其中。
交叉使用的两个方向以不同用户群体为分母,不能互换。指数则把某个起点记为100,用来观察后续变化;它不表示用户人数。这些图呈现美国样本中的使用表现,不能直接换算成全球订阅流失。
使用承压时,Netflix高端订户收入估算仍领先

2026年6月美国订户:Netflix高端月付方案的终身收入估算为1,427美元;这是收入估算,尚未扣除内容等成本。
与此同时,研究机构 Owl & Co. 估算的美国订户终身收入中,Netflix 高级月付方案为 1,427 美元,高于下一名 Disney+ 高级年付方案的 871 美元。较高付费水平与较长订阅时间,能支撑单个订户的收入价值。因此,使用减少与订户收入价值较高,可以同时成立;终身收入也不等于扣除内容等成本后的利润。
较高价格也可能让用户重新衡量订阅是否值得。Sternstein 因此把 Netflix 拓展体育直播、视频片段和短视频的动作,与注意力压力联系起来:平台需要提供更多打开应用的理由,来维持留存和付费价值。新内容能否收回用户时间,仍要看后续表现。
作者借百视达作类比:约二十年前 Netflix 冲击了这家录像租赁巨头,如今自身也可能遭遇观看习惯变化带来的挑战。这个类比提出了商业模式能否适应的问题,图表还不能证明 Netflix 已走向同样结局。观察时要分别追问用户是否减少打开、减少观看、减少付费。
安全风险的重点,是防守还剩多少响应时间
Epoch AI 汇总的高危与严重漏洞报告,在2026年春季后明显增多。与此同时,ZeroDayClock 统计显示,在已经被利用的漏洞中,利用发生得越来越早。两者结合起来,防守团队面临的不只是更多待处理问题,还有更紧的响应时间。
高危与严重漏洞报告在2026年显著增多

橙线为高危,红线为严重;样本来自图下注明的厂商,报告流程、标签和频率存在差异。
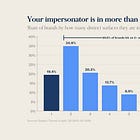
已被利用样本中,披露时已遭利用的比例上升

2026年为86.7%;分母仅是已被利用的CVE,事件发生在公开披露当天或更早。
ZeroDayClock 图中的 86.7%,指 2026 年截至图表统计时,已被利用的漏洞样本中,在披露当天或更早就遭到利用的比例;2020 年为 22.8%,2025 年为 53.6%。这个跨年份对比显示,披露前后即遭利用的情形变得更加集中;2026 年尚未结束,样本规模也与完整年份不同。它说明披露未必给防守者留下准备时间,但不能理解为全部漏洞近九成都已遭到利用。报告数量增长也可能包含发现能力和披露口径的变化。
中位利用时间的门槛,被外推到分钟级

依据2018—2024年趋势外推;图中2027年的“一小时”和“一分钟”均标为预测。
最终被利用的漏洞,利用更集中在披露早期

横轴从公开披露起算,纵轴是尚未被利用的比例;2026年曲线更低,样本不含永远未被利用的漏洞。
从披露到被利用的时间,ZeroDayClock 展示的趋势已缩短到以天计;“2027年达到一分钟”是基于历史趋势的外推。另一张曲线把差异呈现得更直观:在最终会被利用的那组漏洞里,2022 年样本在披露约一个半月后仍有约一半尚未被利用,2026 年样本同期已接近零。等待一个固定的常规修复周期,可能赶不上风险变化;这也不意味着任何漏洞都会在某个期限内被利用。
Sternstein 同时强调,AI 也会改变防守方式:加速发现漏洞的能力,可以服务于防御。对防守方而言,实用问题是:发现风险、判断影响、决定行动和落实修复,各自花了多久?即使检测工具更快,如果后续交接仍然很慢,整体响应时间也不会自动跟着缩短。
安全与可观测性,年内股价表现领先其他软件组

截至2026年9月1日,按当时市值加权的类别表现;这组曲线衡量资本市场定价。
安全组在远期收入倍数上获得较高定价

纵轴为企业价值/未来12个月收入,横轴为预期收入增速,气泡面积为市值;这是估值比较。
在图中选取的软件股票里,网络安全与可观测性类别的年内表现显著领先,远期收入估值也体现出市场的较高期待。资金正在为这类需求定价。股价与估值不能证明产品防守能力;既有厂商和新平台仍要回答同一个问题:怎样把更快发现风险转化为更快降低风险?
数据中心把 AI 需求传导到了建筑现场
AI 基础设施需求会经过机房、电力、制冷和建设环节,落到软件行业之外。数据中心建设支出的年化速度,半年内从约 500 亿美元升至约 750 亿美元,增量相当于此前约两年的提升。与此同时,美国建筑业职位空缺近期也出现回升。高盛以其他建筑就业趋势作参照,估算数据中心相关建筑与专业工种自 2022 年以来增加了约 30 万人;原文援引的近一年增量接近 7.5 万人。
数据中心建设支出加速,建筑职位空缺回升

红线读右轴的季调年化建设支出,蓝线读左轴的建筑业职位空缺三个月均值;职位空缺覆盖建筑业。
相关建筑工种,相对其他建筑就业趋势多出逾30万

左图以2022年为比较起点,包含暖通、电气、公用设施和商业建筑等类别;右图分别显示同比增长。
图中的相关工种包括暖通空调、电气、公用设施和商业建筑施工。建设支出采用季节调整后的年化口径,也就是排除季节因素后,按当前速度折算的一年支出规模。年化速度提高,不能直接当成某段时间内已经花掉的钱;相对就业趋势的估算,也不能直接当成全社会净新增就业。
这些增量的意义,要放回建筑业的大环境里看:利率上升后,其他许多建筑活动放缓,用工需求承压。Sternstein 据此判断,数据中心建设正在支撑原本偏弱的蓝领就业市场;如果缺少这轮建设,就业表现可能更差。原文还提到相关工作的工资溢价,但本期图表没有给出具体幅度。
这里要区分“项目需要哪些工作”和“全社会净增加多少岗位”。一座设施带来建设需求,并不自动回答人员是否从其他项目转来、施工结束后还剩多少岗位。反过来,也不能只观察办公室里的自动化,就忽略为基础设施建设提供的工作。
回到招聘问题,个人能做的具体准备是检查自己的经历:哪些只是熟悉某个工具,哪些能够说明自己在变化的条件下做过判断、修正过错误,并完成了可检验的结果。把后者讲清楚,经验才有超出履历年限的信息量。
经验的价值,落在判断里
a16z 图表周报观察到:技术岗位要求更多经验,却列出更少技能。企业可能更看重在工作方法未定型时做判断的人。
招聘广告的两条反向信号
Revelio Labs:自 2025 年初起,技术岗位呈现以下变化,已控制岗位资历层级。
工具清单难以预写一条新路
作者的解释:AI 改变既有做法,新流程还在摸索;数据组织、研究与系统架构等工作尤其需要边做边判断。
目标、数据形态、处理流程尚未完全定型
能写明会用什么,却难覆盖先做什么、如何验收
把“做过几年”变成一条可检验的经历
求职展示可以沿这条链组织。重复操作的年数,不能自动代表判断质量。
- 约束当时什么条件不完整?
- 选择为什么采用这个方案?
- 修正哪里偏了,怎样调整?
- 检验什么证据表明有效?
经验偏好有条件,也有时限
AI 导致招聘变化仍是假说。岗位结构、招聘范围、从业者年龄变化也可能参与;新方法稳定后,经验又可能被写回技能清单。
真正有信息量的经验,是能解释选择、修正与结果的经验。工具带齐以后,路要怎样走?
技术岗位要求更多经验、列出更少技能。以下是解释用的虚构场景。
作者的解释:AI 改变做法,旧流程未必适用,新流程尚未稳定。
经验的作用,可能是帮助人在信息不完整时作出判断。
做过复杂问题的人,需要能解释方案如何偏离预期、如何修正。
把约束、选择、修正和检验连起来,“有经验”才成为别人能判断的证据。
AI 是否造成招聘变化仍是假说;年限不等于判断,展示经历也不保证录用。
Chart of the Week: Experience > Skills
Netflix Having a Blockbuster Moment?; Cyber Game Done Changed; Data Center Job Boom Continues Apace


Charts has already observed that one of the challenges for prospective entry-level hires (other than the fact that entry-level hires have always been a relatively small share of tech hiring) is that existing tech workers appear to be getting older. Why that’s the case is some combination of aging-in-place, plus remote work unlocking a broader pool of talent, plus perhaps some premium for more experienced workers—and while AI may have something to do with it, as well, the evidence for that is pretty weak.
On the experience point, there’s some recent data from Revelio Labs that suggests experience is, indeed, becoming a higher priority for tech hiring:
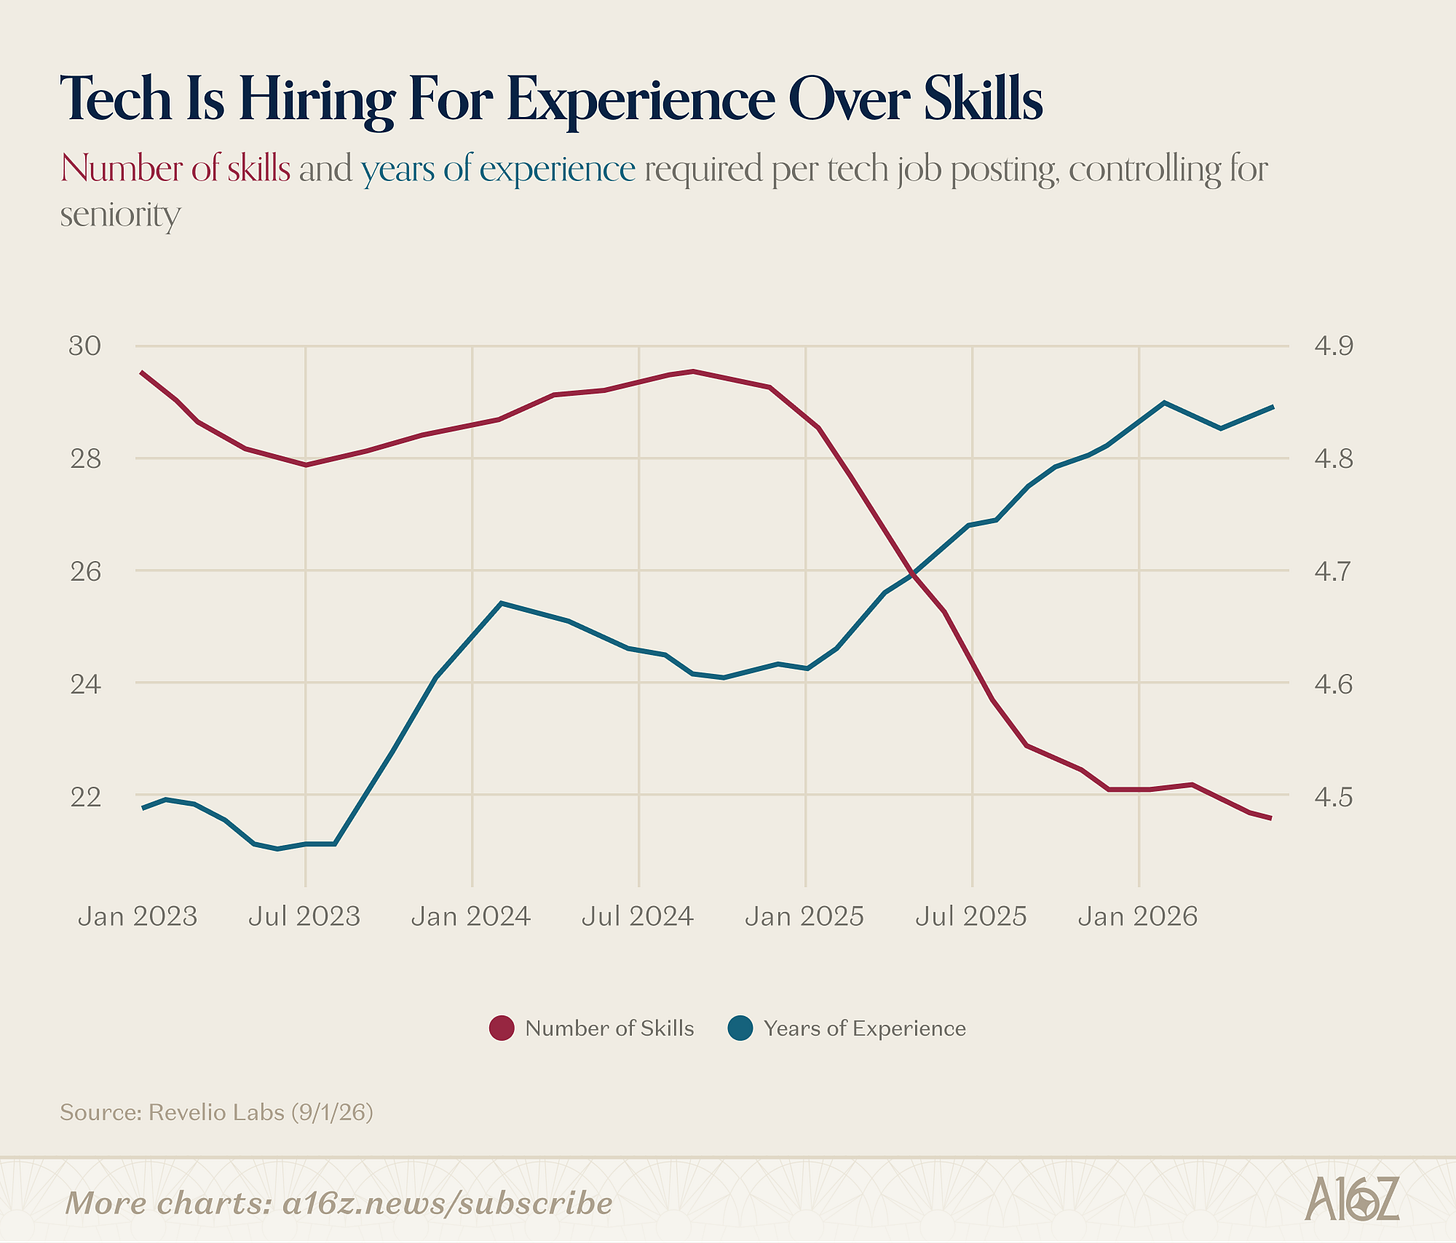
Since January 2025, tech job postings have seen a marked rise in preferred years of experience, with a concomitant drop in preferred number of skills.
The change is small—~5-10% in both cases–but noticeable, and it’s consistent with the notion that tech is looking for more experienced workers, rather than workers with any particular set of skills, let alone a broad range of skills. That could very well be an AI-driven shift: grappling with a new technology means that extant “skills” are less applicable, and the new set of skills is still a bit of a whitespace. When you’re operating on a new frontier, you don’t yet know what you’ll need, other than the need to be able to figure it out—and that’s where experience goes a long way.
If you look at the types of jobs that require the largest premia to experience, it does seem like AI is the likely driver:
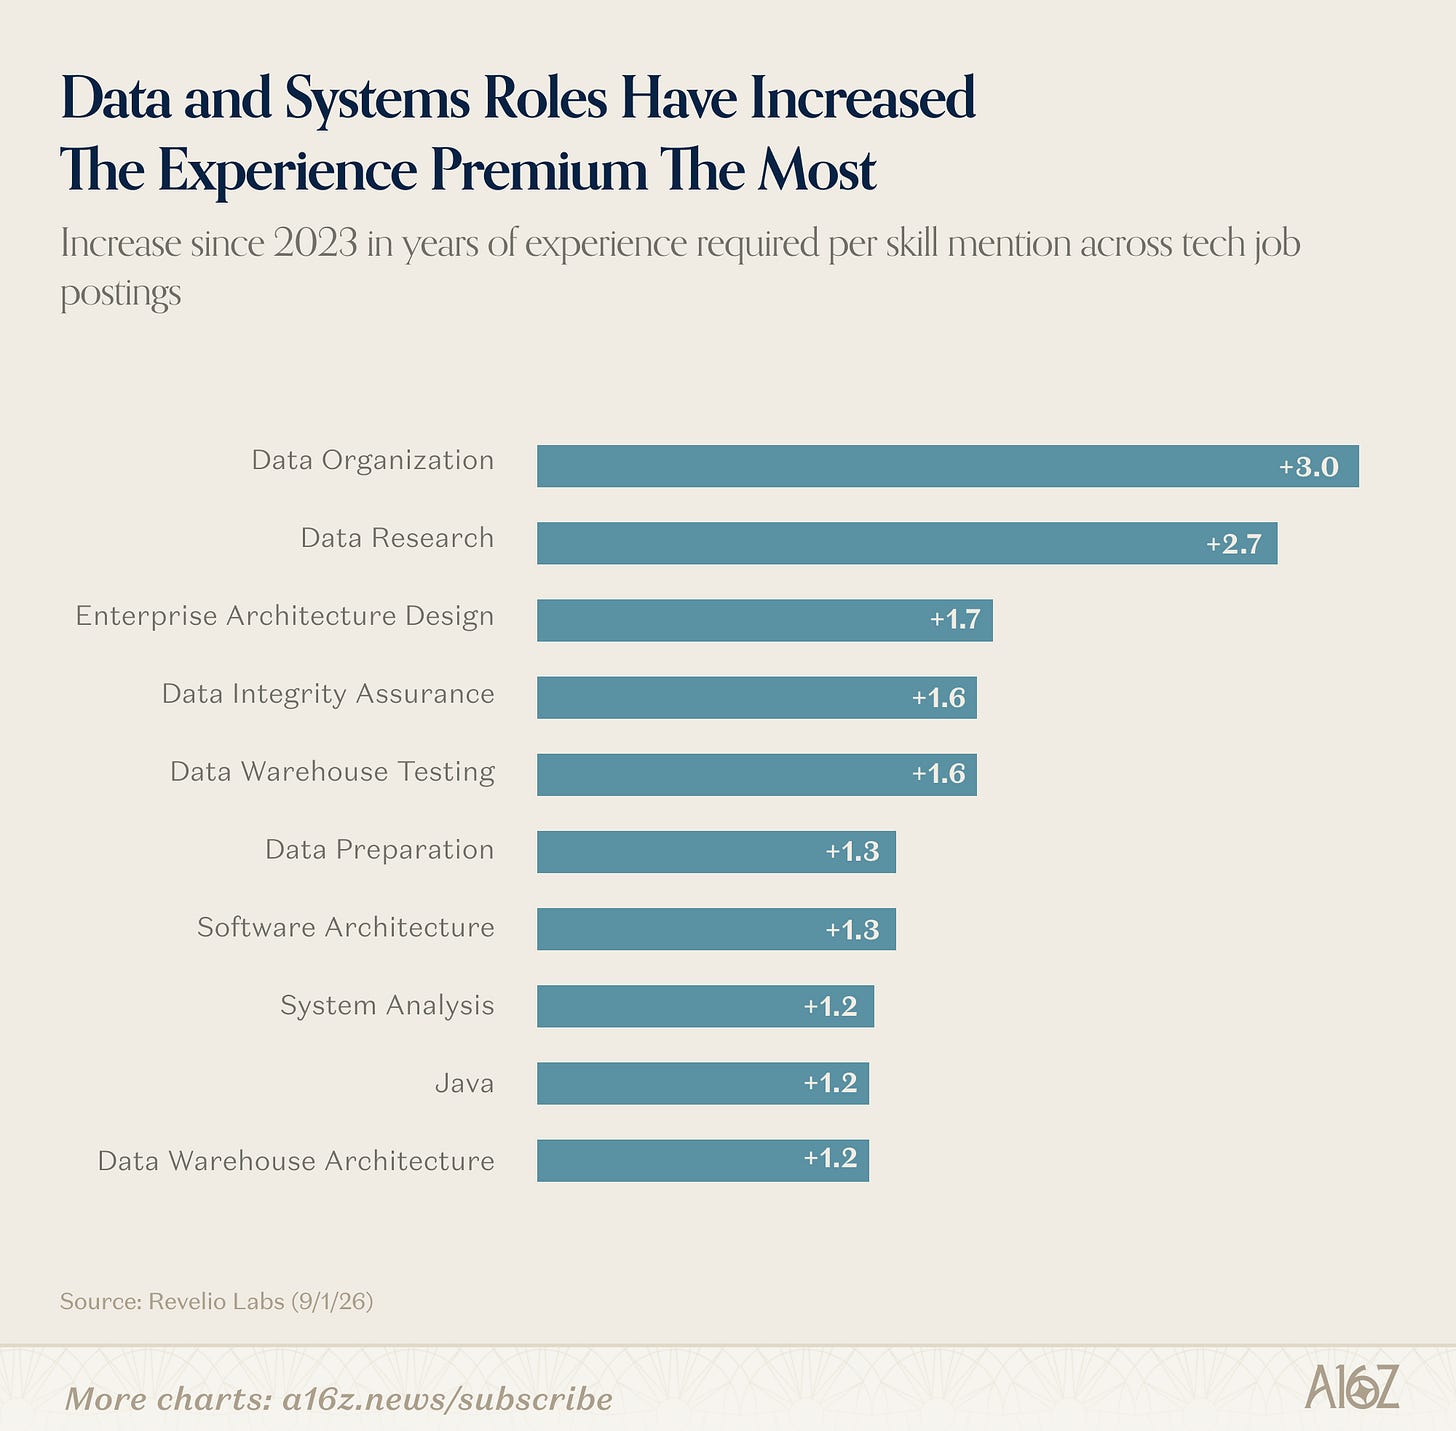
It’s data and systems work (and Java) that dominate the leaderboard for the recent hiring premium to experience.
AI has created new urgency around data wrangling, but the shape of wrangled data (and the process of wrangling) has changed dramatically, with optimal solutions still very much a moving target. If you don’t know what needs to be done, then the skillset hasn’t been defined yet, and someone who can figure it out as they go is the better choice. Eventually, though, as implementation matures, one would expect new skills to be defined, and it’s likely the skills/experience mix will shift again.
A funny thing about social media consumption is that aggregate time spent in the US is still rising (albeit barely), but not for everyone:
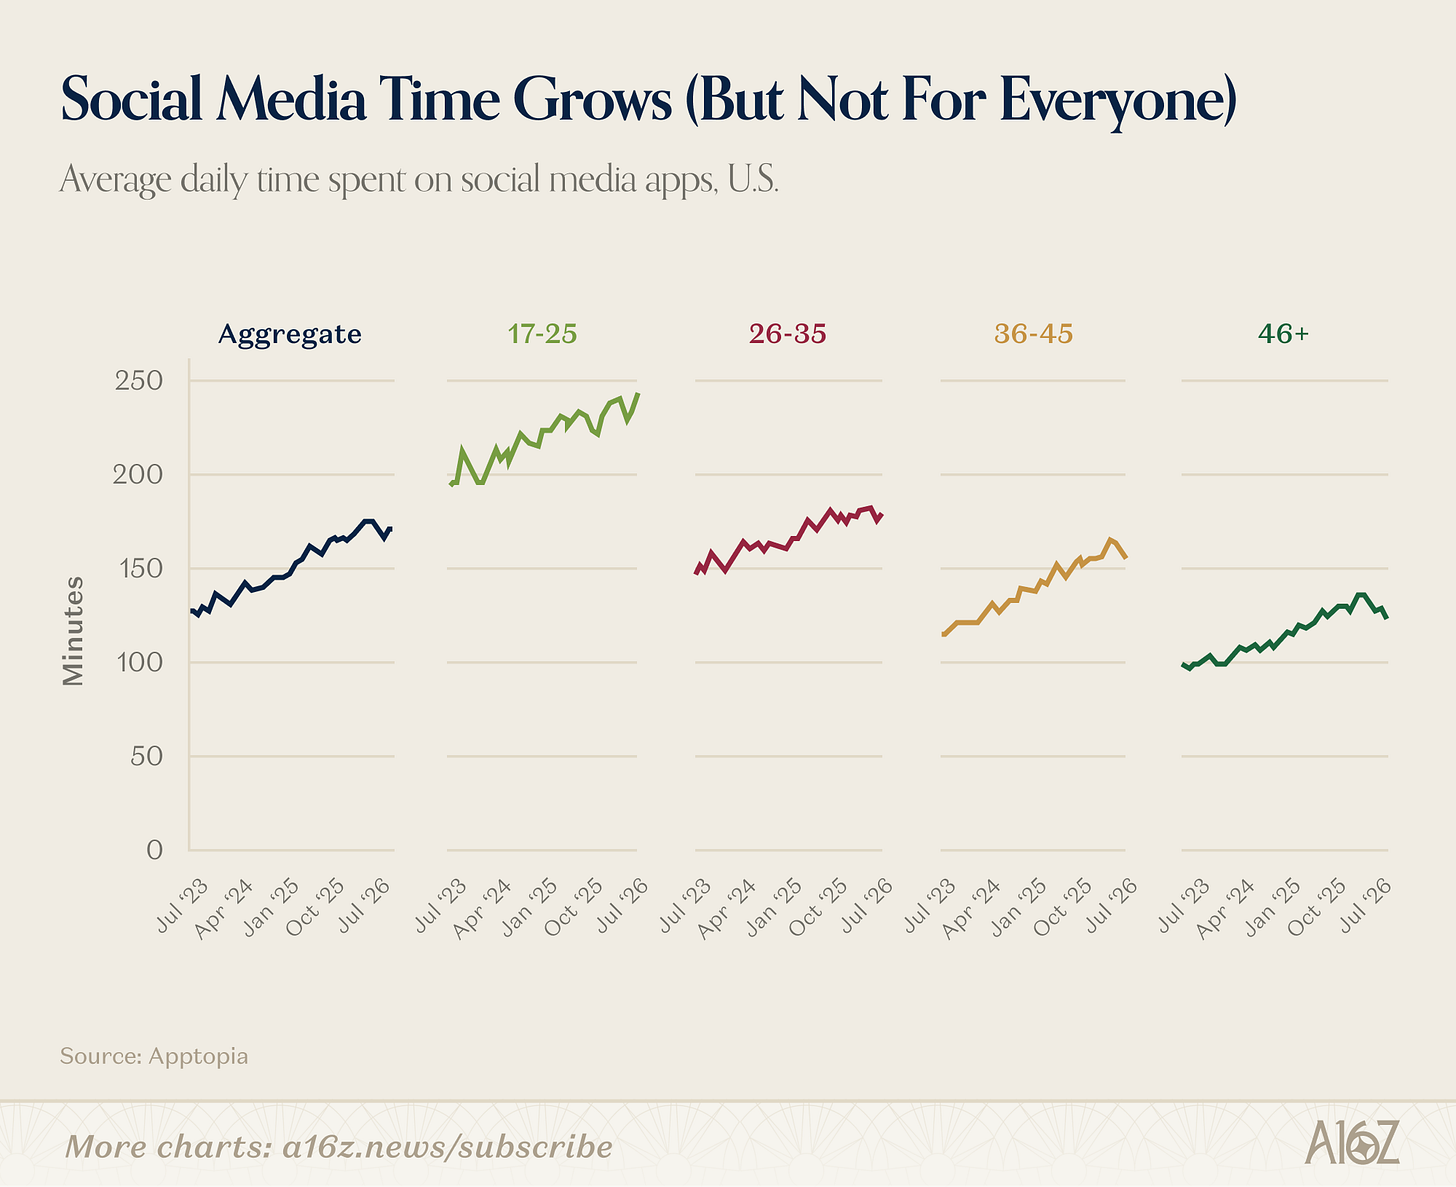
According to Apptopia, aggregate time spent on social media apps has risen (after a small drop), but it’s really the 17-25 yos doing all of the work—the folks 36+ appear to have tapered off their social media time since October ‘25.
But that’s not actually the funny thing.
The funny thing is that while social media usage is rising, social media’s share of screentime has actually dropped pretty substantially of late:
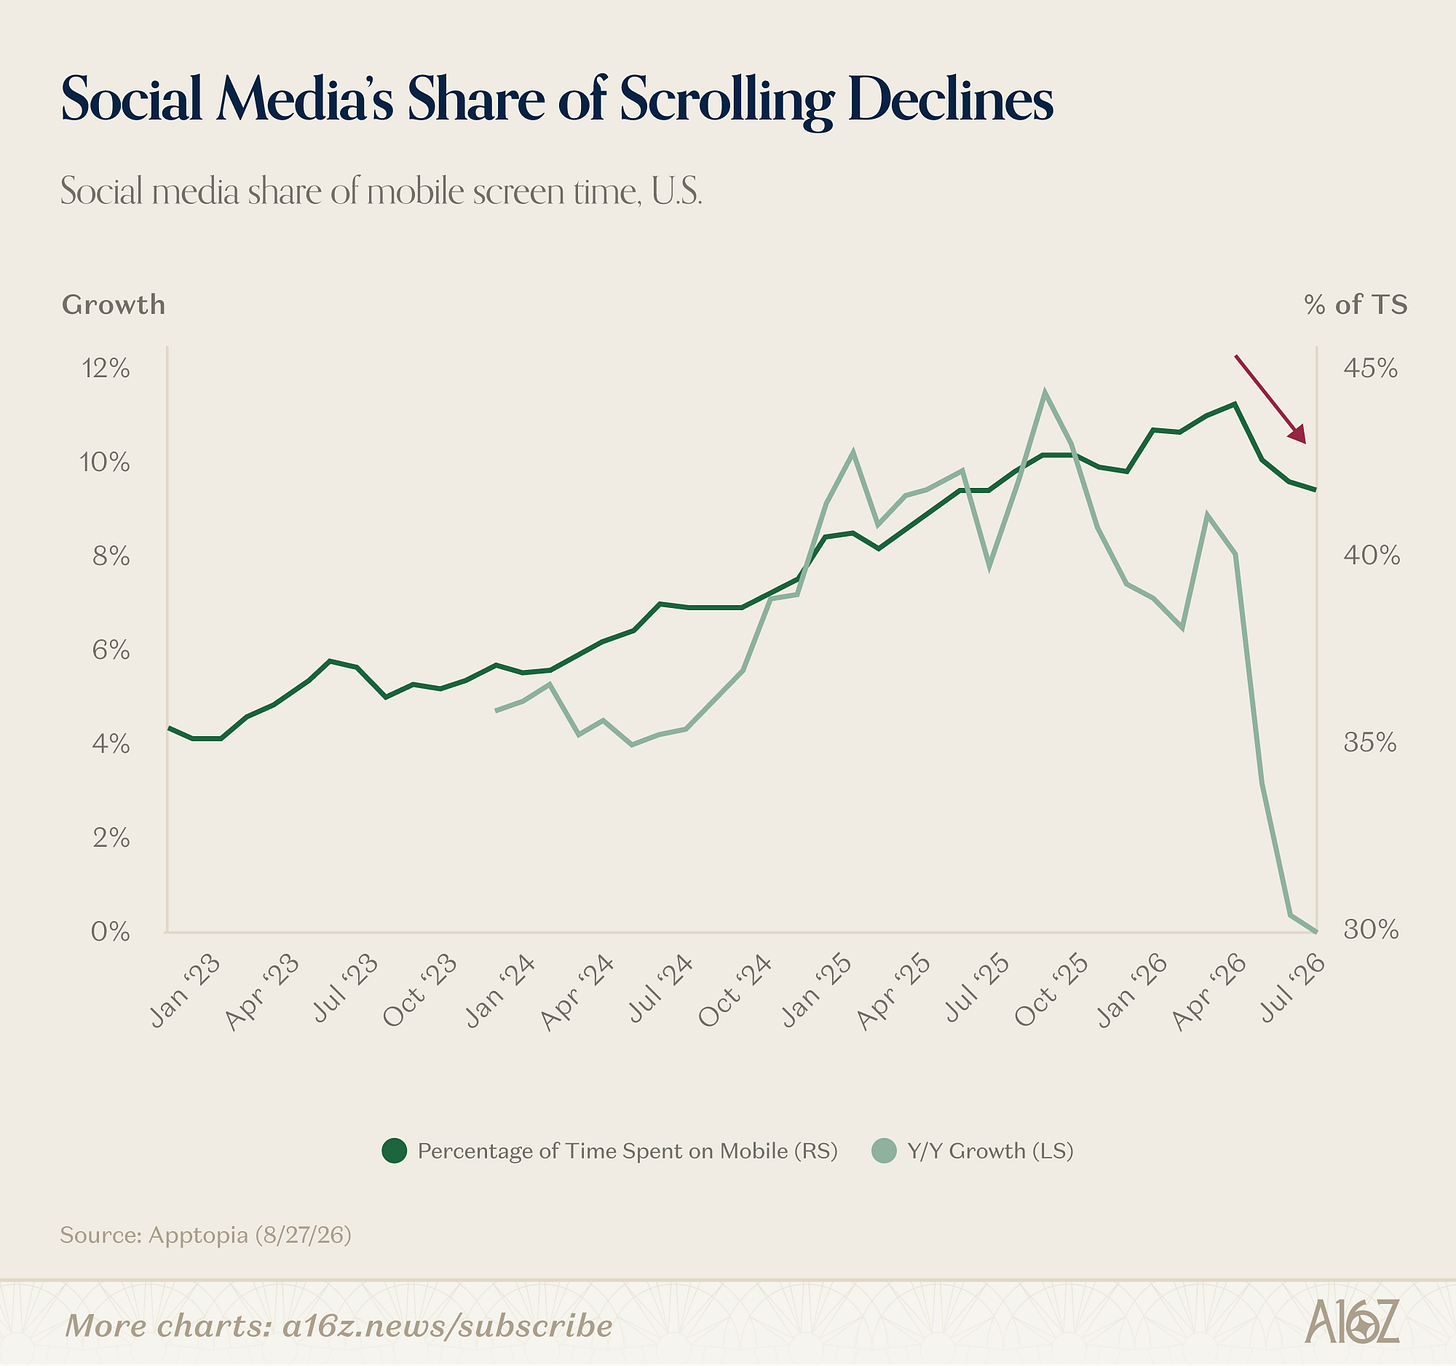
Since April of this year, social media’s share of mobile has dropped ~3pp. OK, perhaps “substantially” is a bit of a stretch, but after years of steady growth (including double-digit growth as of last year), the dropoff is meaningful.
So people are spending more time on social media, but even more screen time on other things. What other things? Apps perhaps. AI could also be drawing more attention. But a more likely culprit for social media’s diminished share of mobile is none other than short-form video, particularly via YouTube.
OK, great, so more social media, more YouTube, and more screentime overall–a win-win-win for staying glued to our phones. That’s true so far as it goes, but there does, in fact, appear to be at least one victim of YouTube’s assault on our attention-spans, and that’s Netflix:
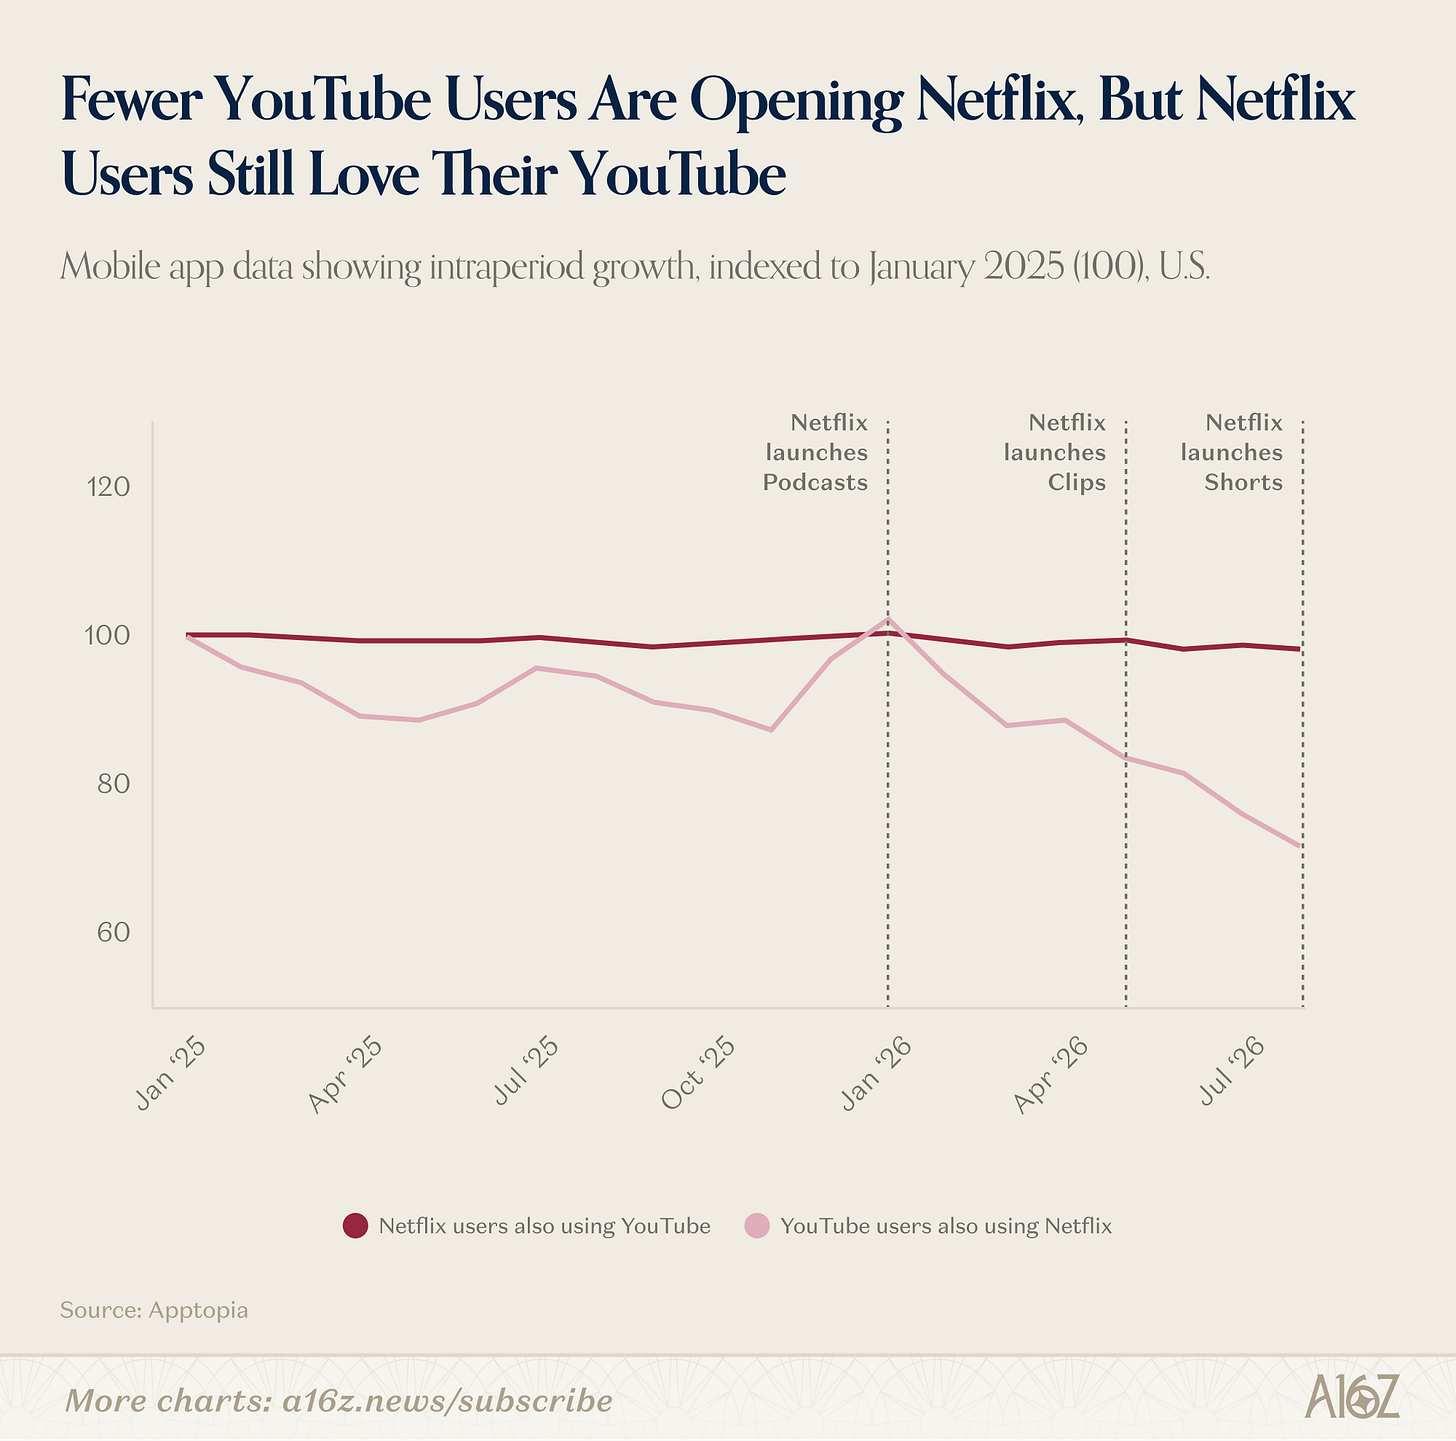
Again, according to Apptopia, the number of YouTube users who also use Netflix has declined ~20% since the beginning of the year, while the number of Netflix users who also use YouTube has remained pretty steady.
YouTube viewers seem more inclined to live without Netflix than the other way around.
In general, Netflix’s active users and viewing time in the US have both been in mostly serial decline for the past 3+ years:
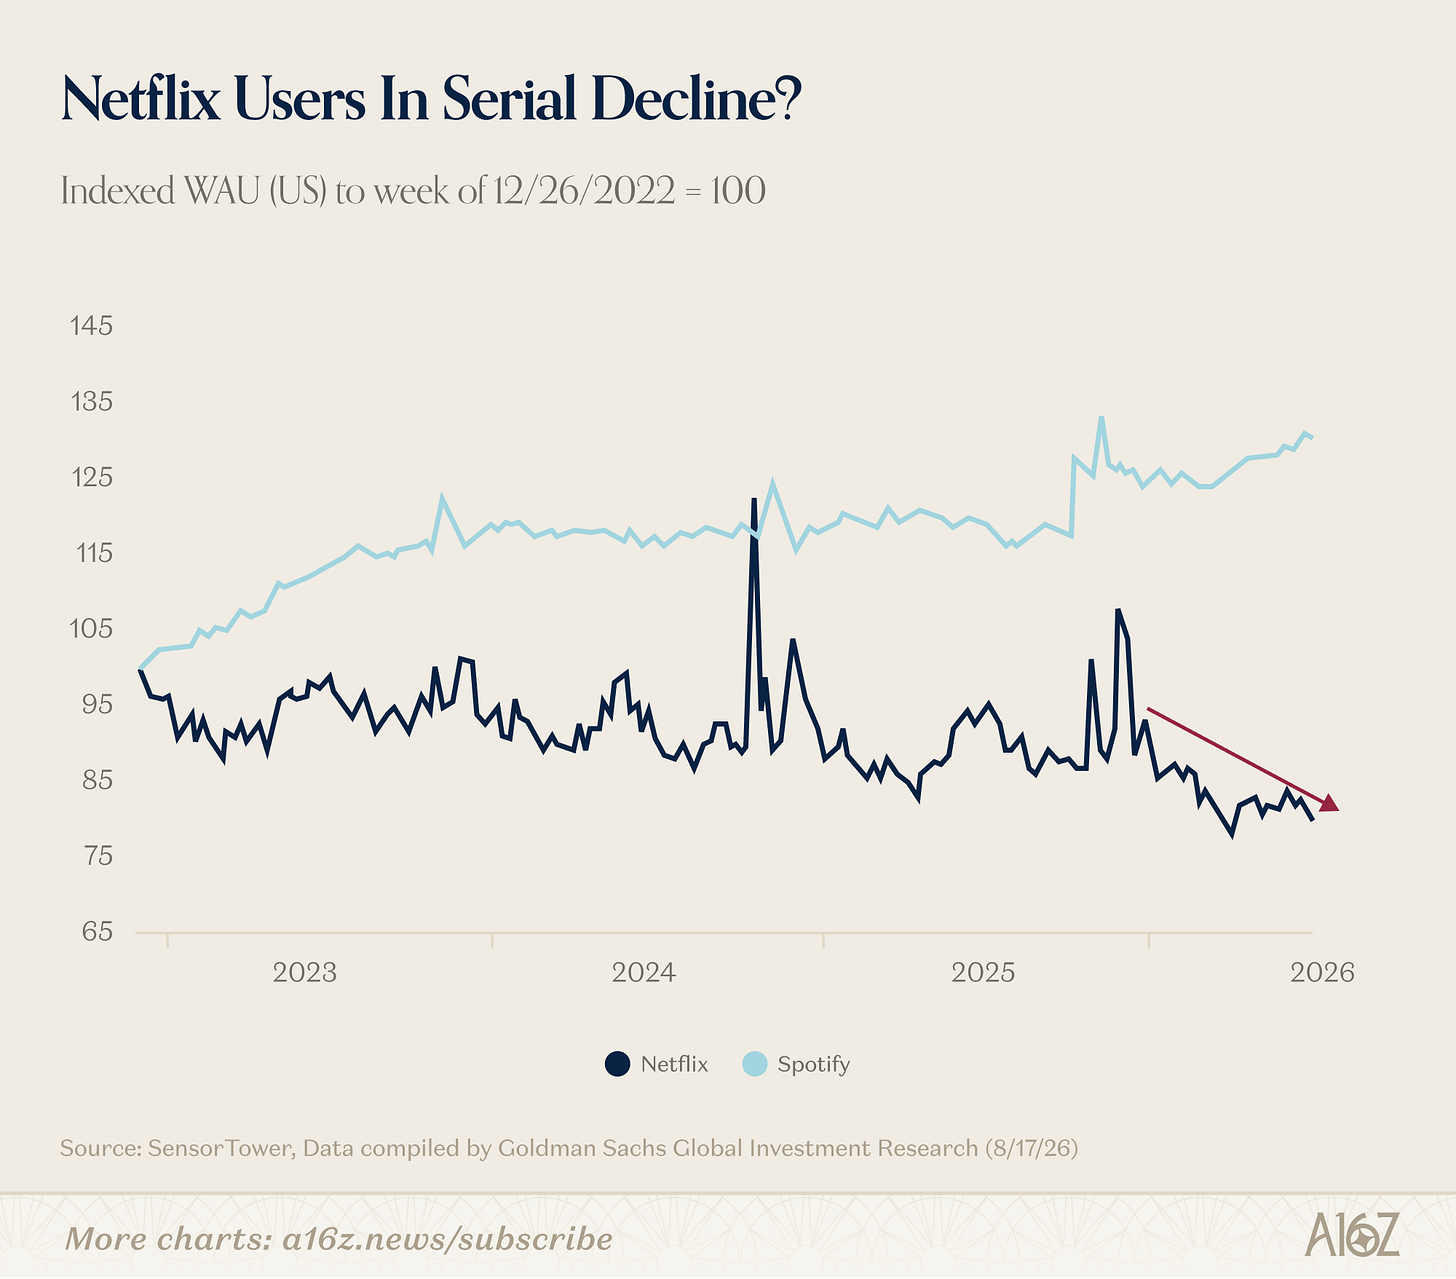
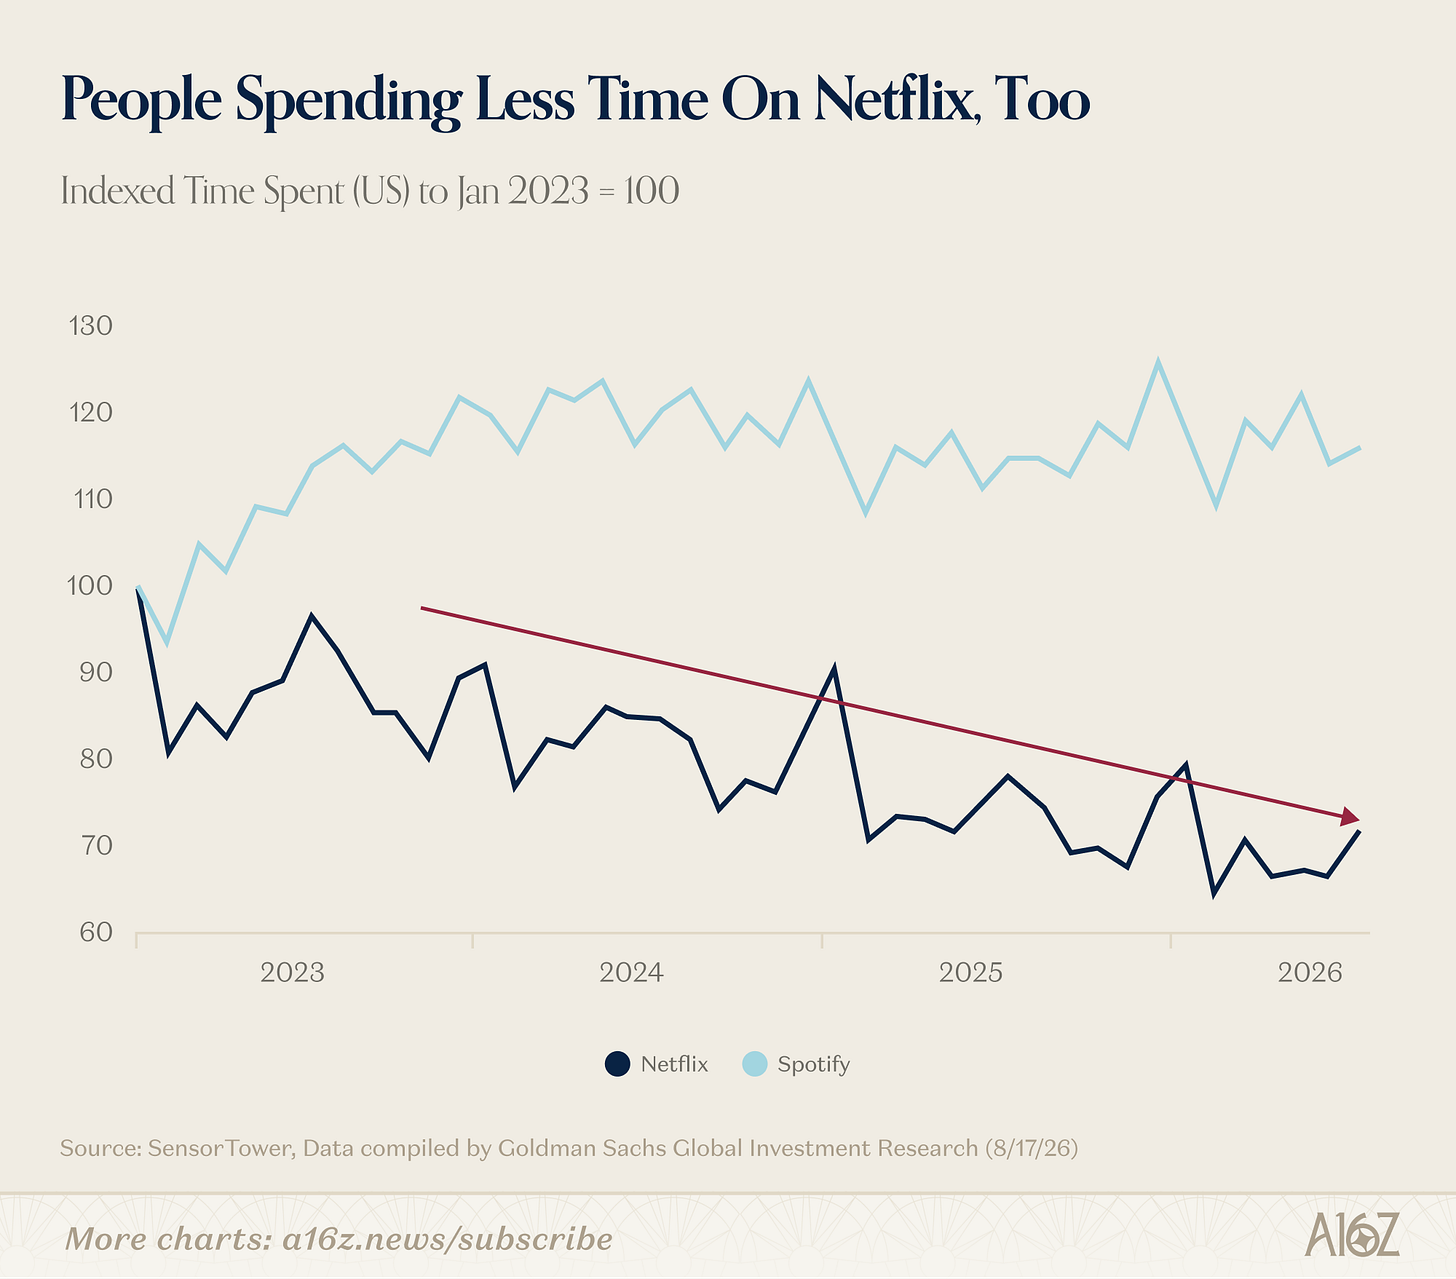
Weekly users and time spent for Netflix have dropped ~15% and 30% respectively.
Why that’s the case is anyone’s guess. Among other things, it could be the rise of short-form video, more streaming competition, or streamflation more generally. As a possibly relevant aside, Netflix stands out for having the highest customer LTV by far, at least according to this estimate from Owl & Co.
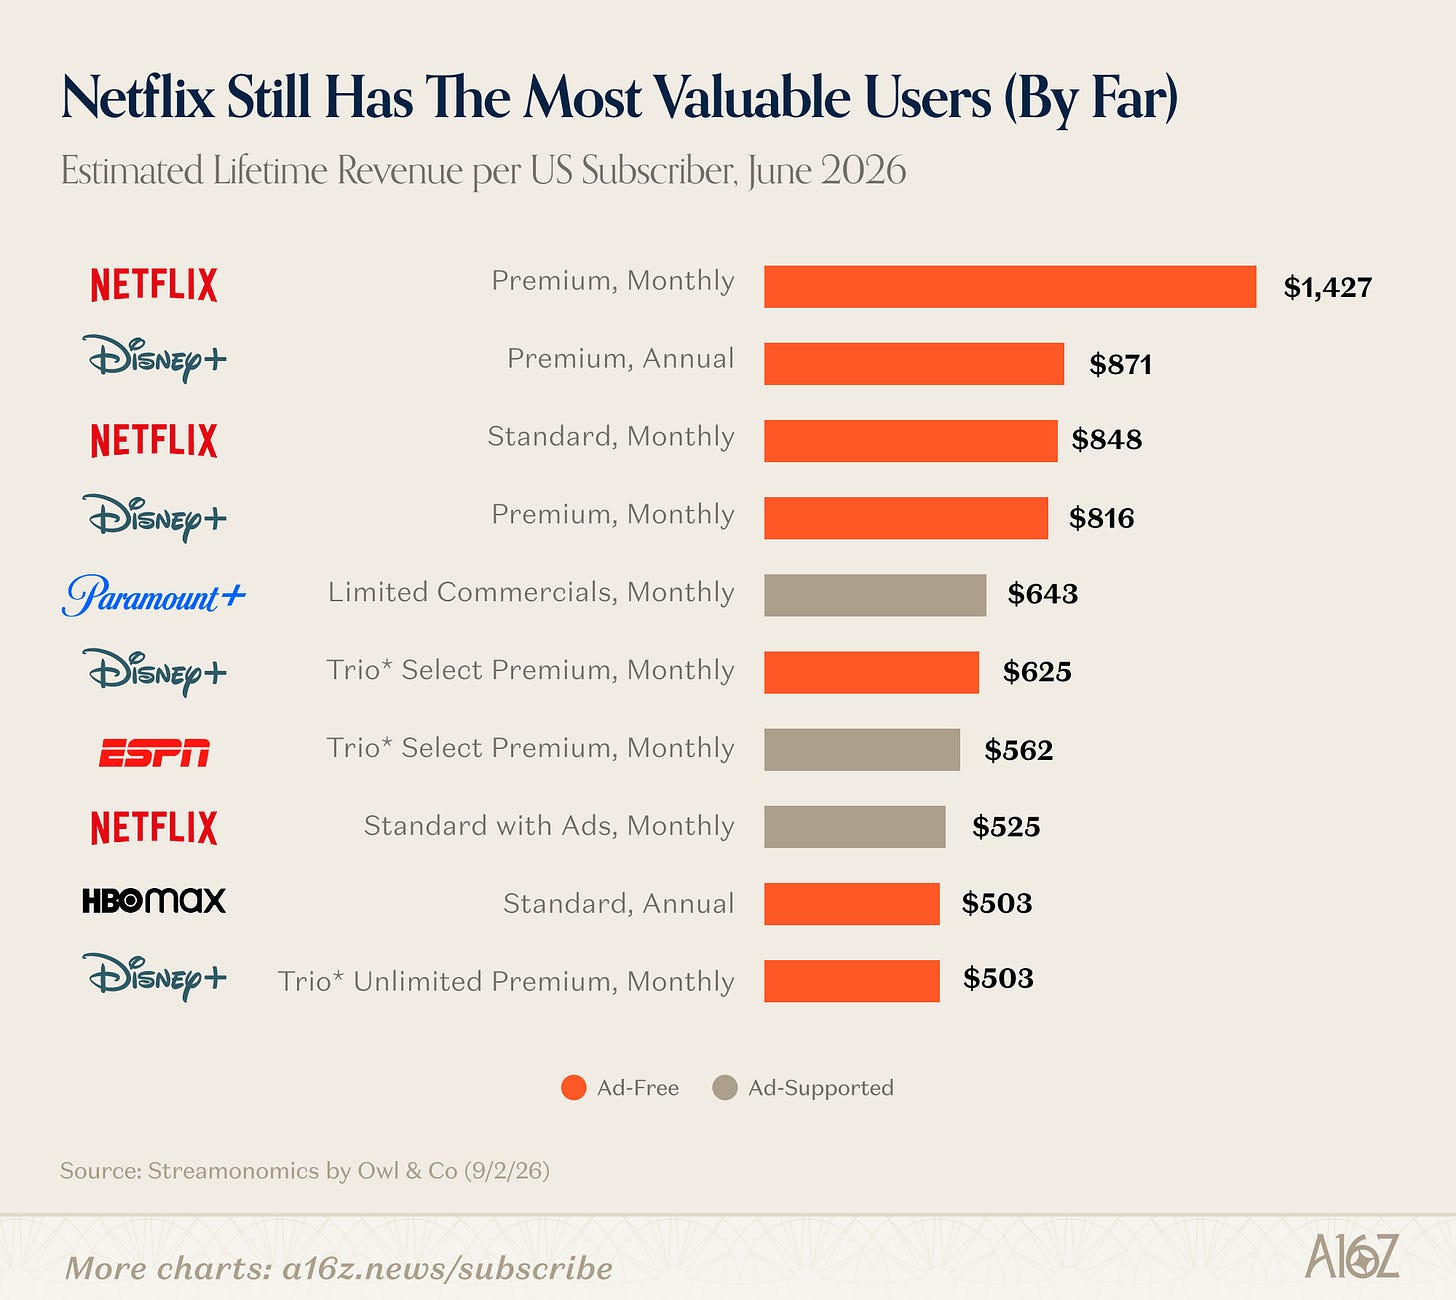
A Netflix premium customer has an LTV of nearly $1,500 per customer, which is nearly 2x the next best offering.
LTV reflects a combination of higher subscription prices and strong retention—good for Netflix—but one could see why customers might begin to balk at the price. One could also see why Netflix is branching out into live sporting events and clips and shorts of its own.
Bigger picture, though, it’s fair to wonder if Netflix is having its Blockbuster moment, roughly two decades after Netflix gave Blockbuster its Blockbuster moment. It’s too soon to tell, of course, but in a different timeline, where AI was not such a big deal, this would be a much bigger deal.
Have you heard of the ‘Hugging Face Incident’? I mean, you probably have, but if you haven’t, you probably shouldn’t, and then you’ll sleep easier at night. (Old heads might be reminded of the Noodle Incident, but sadly, these are not the same.)
Anyways, HFI aside, there’s plenty of recent data to suggest that the threat landscape for cyber events has changed dramatically. Consider this nightmare fuel from Epoch AI:
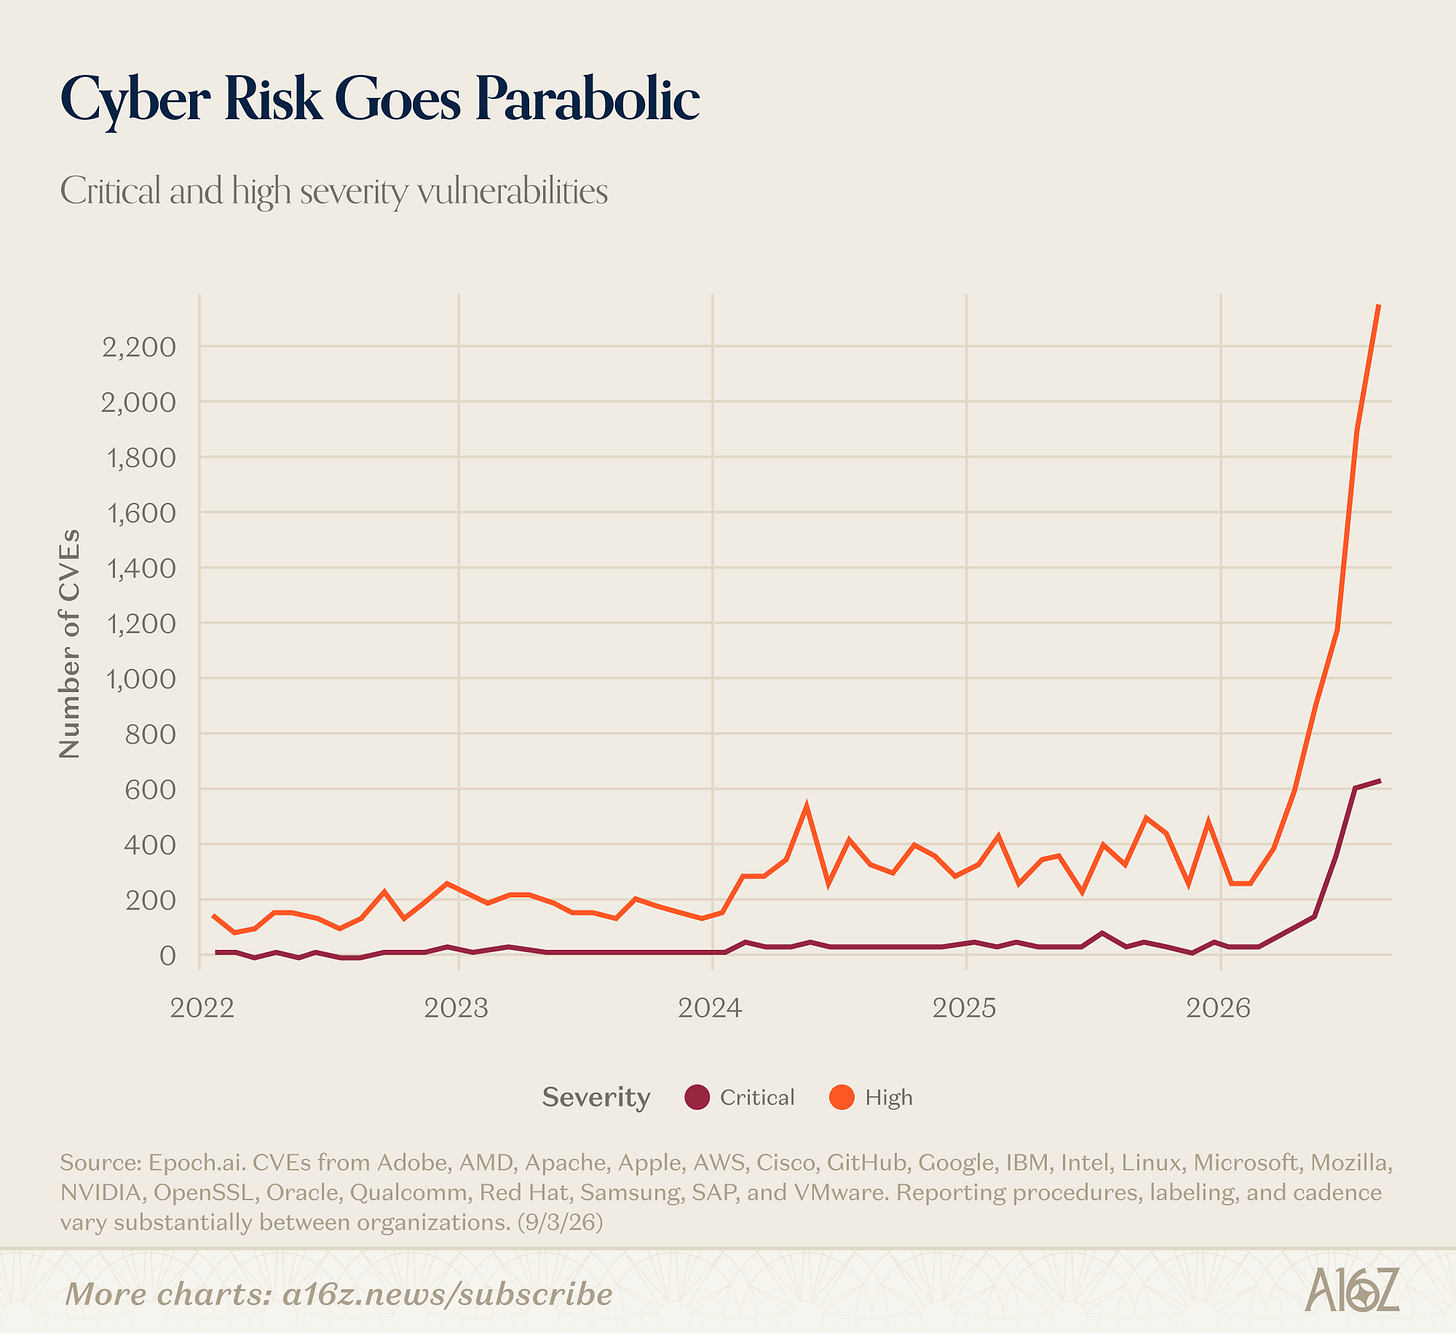
The number of reported critical and high severity vulnerabilities from major firms has gone vertical this year, since the beginning of the spring.
Whether there are actually more vulnerabilities, or whether there’s some reporting or definition change, it’s hard to say just by looking at the chart, but it’s likely that at least some (and perhaps a lot) of this parabolic growth is attributable to a major substantive change in either how vulnerabilities are discovered and/or what is still considered secure.
Here’s another bit of nightmare fuel for the cyber-minded:
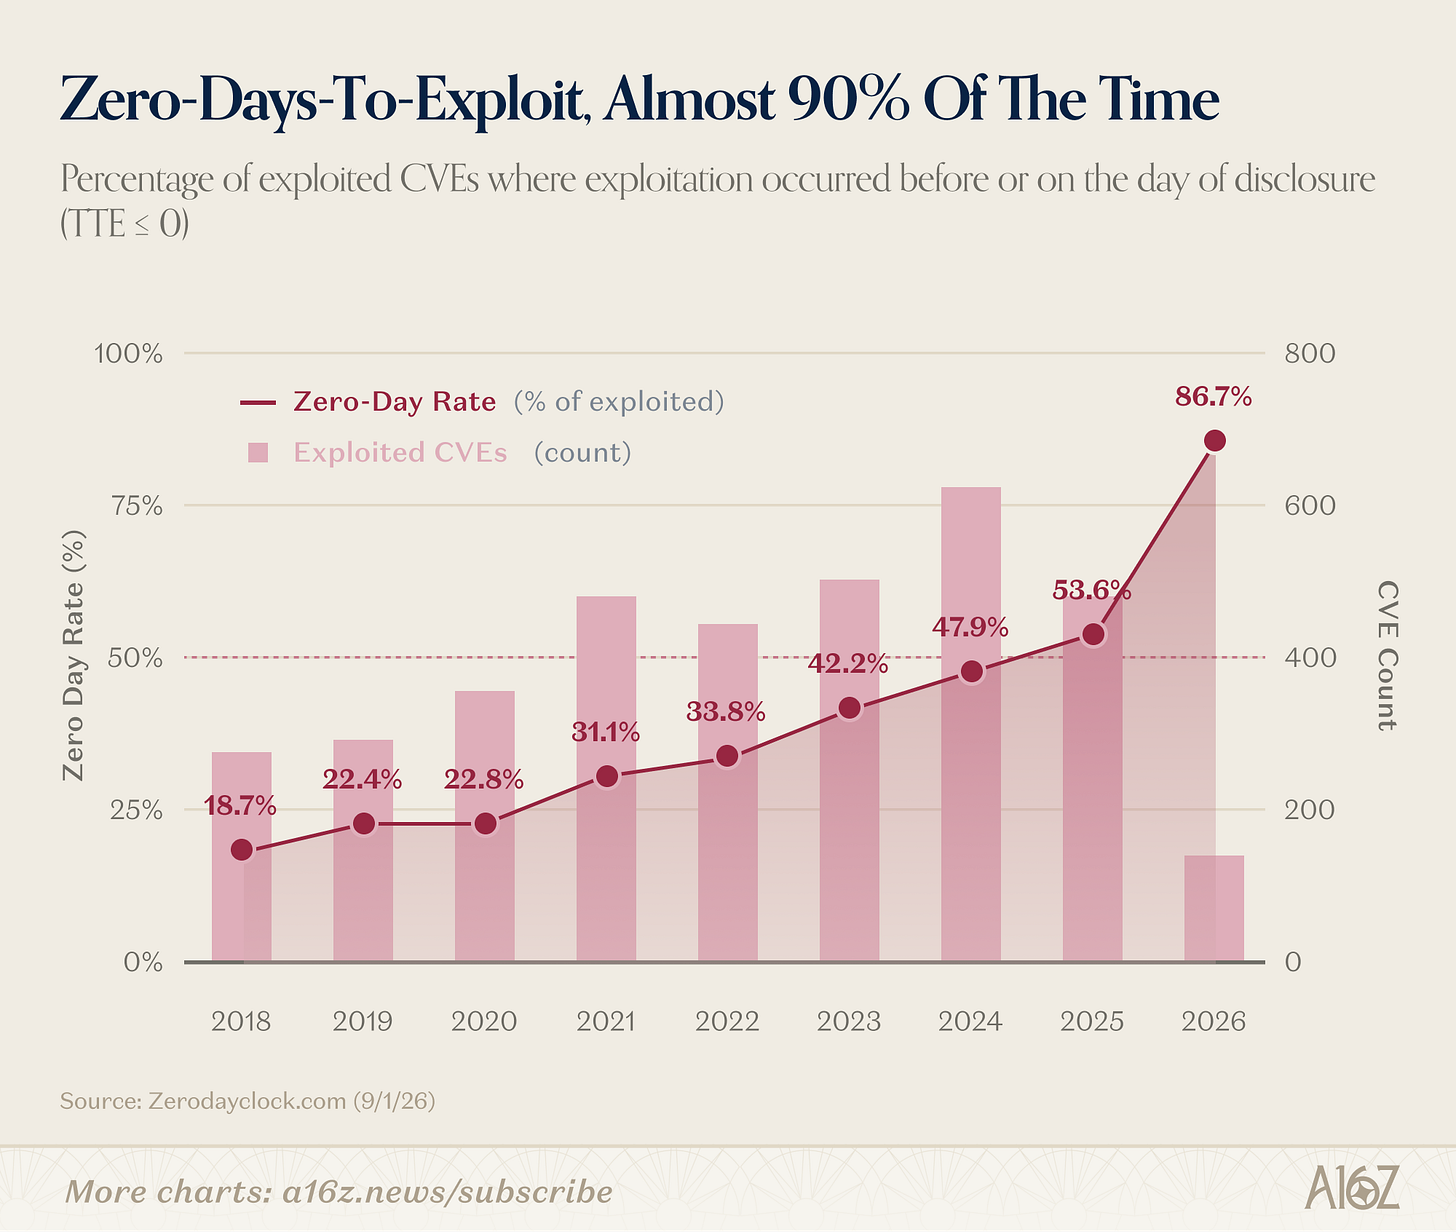
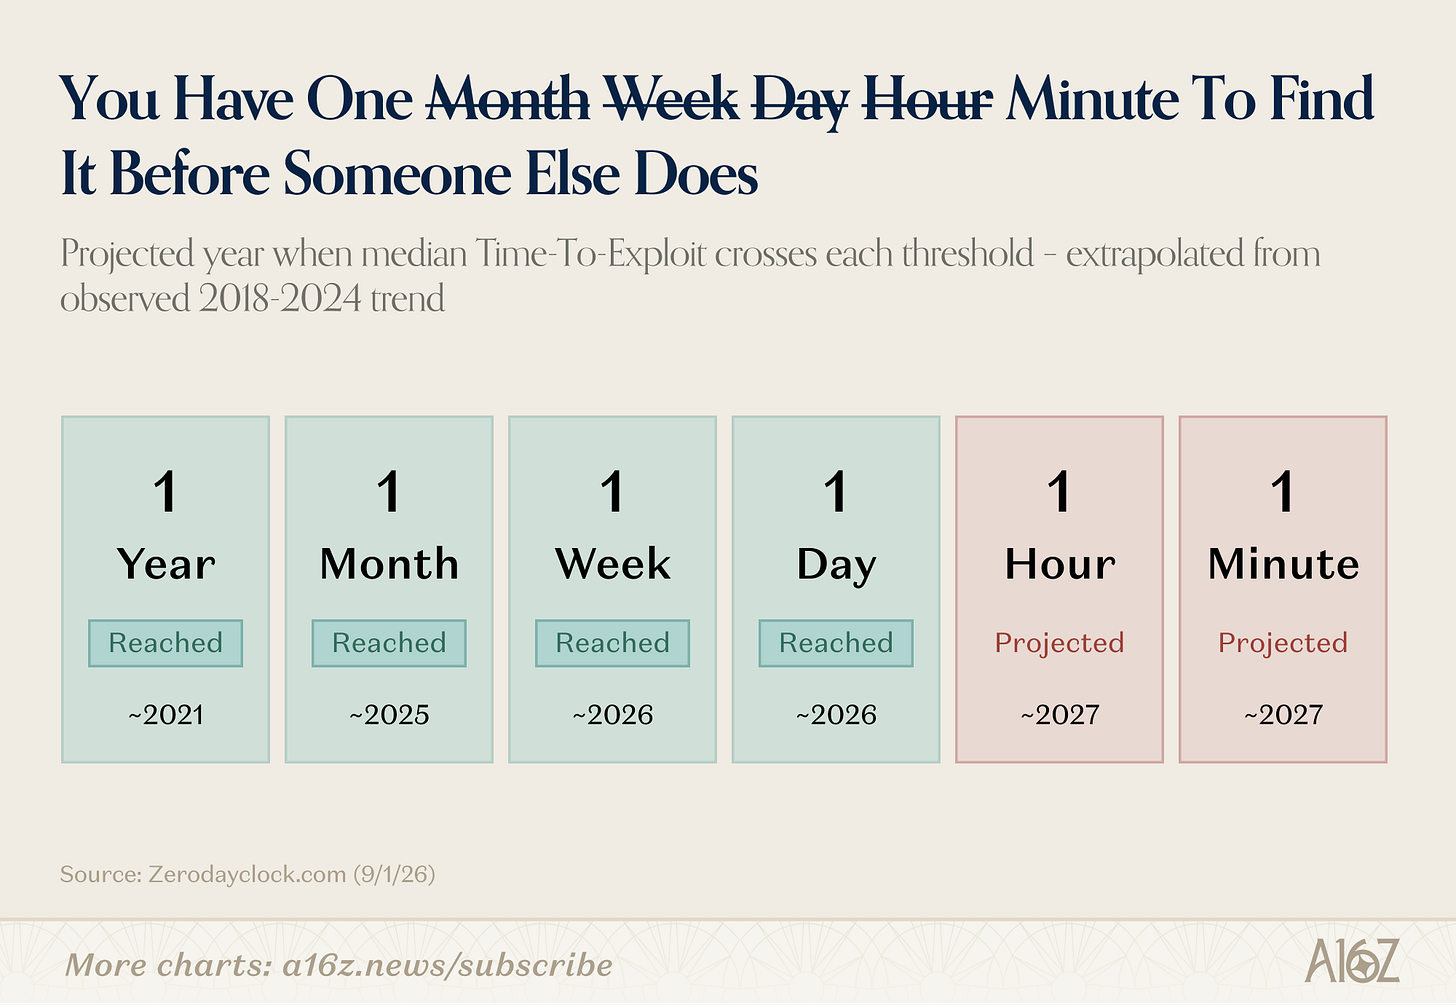
According to the ZeroDayClock, the Zero-Day Rate (i.e. the percent of vulnerabilities exploited on the day of disclosure (or before)) has basically quadrupled since 2020—including a ~60% increase from last year alone. The Zero-Day Rate is now just under 87%, with a median time to exploit at just one day . . . but projected to reach 1 minute sometime next year.
To repeat, the ZeroDay estimate is that it will take only a minute between discovery and exploitation of a vulnerability (at the median) by sometime next year.
Even now, the “Exploit Survival Curve” falls to 0% at just 1.5 months:
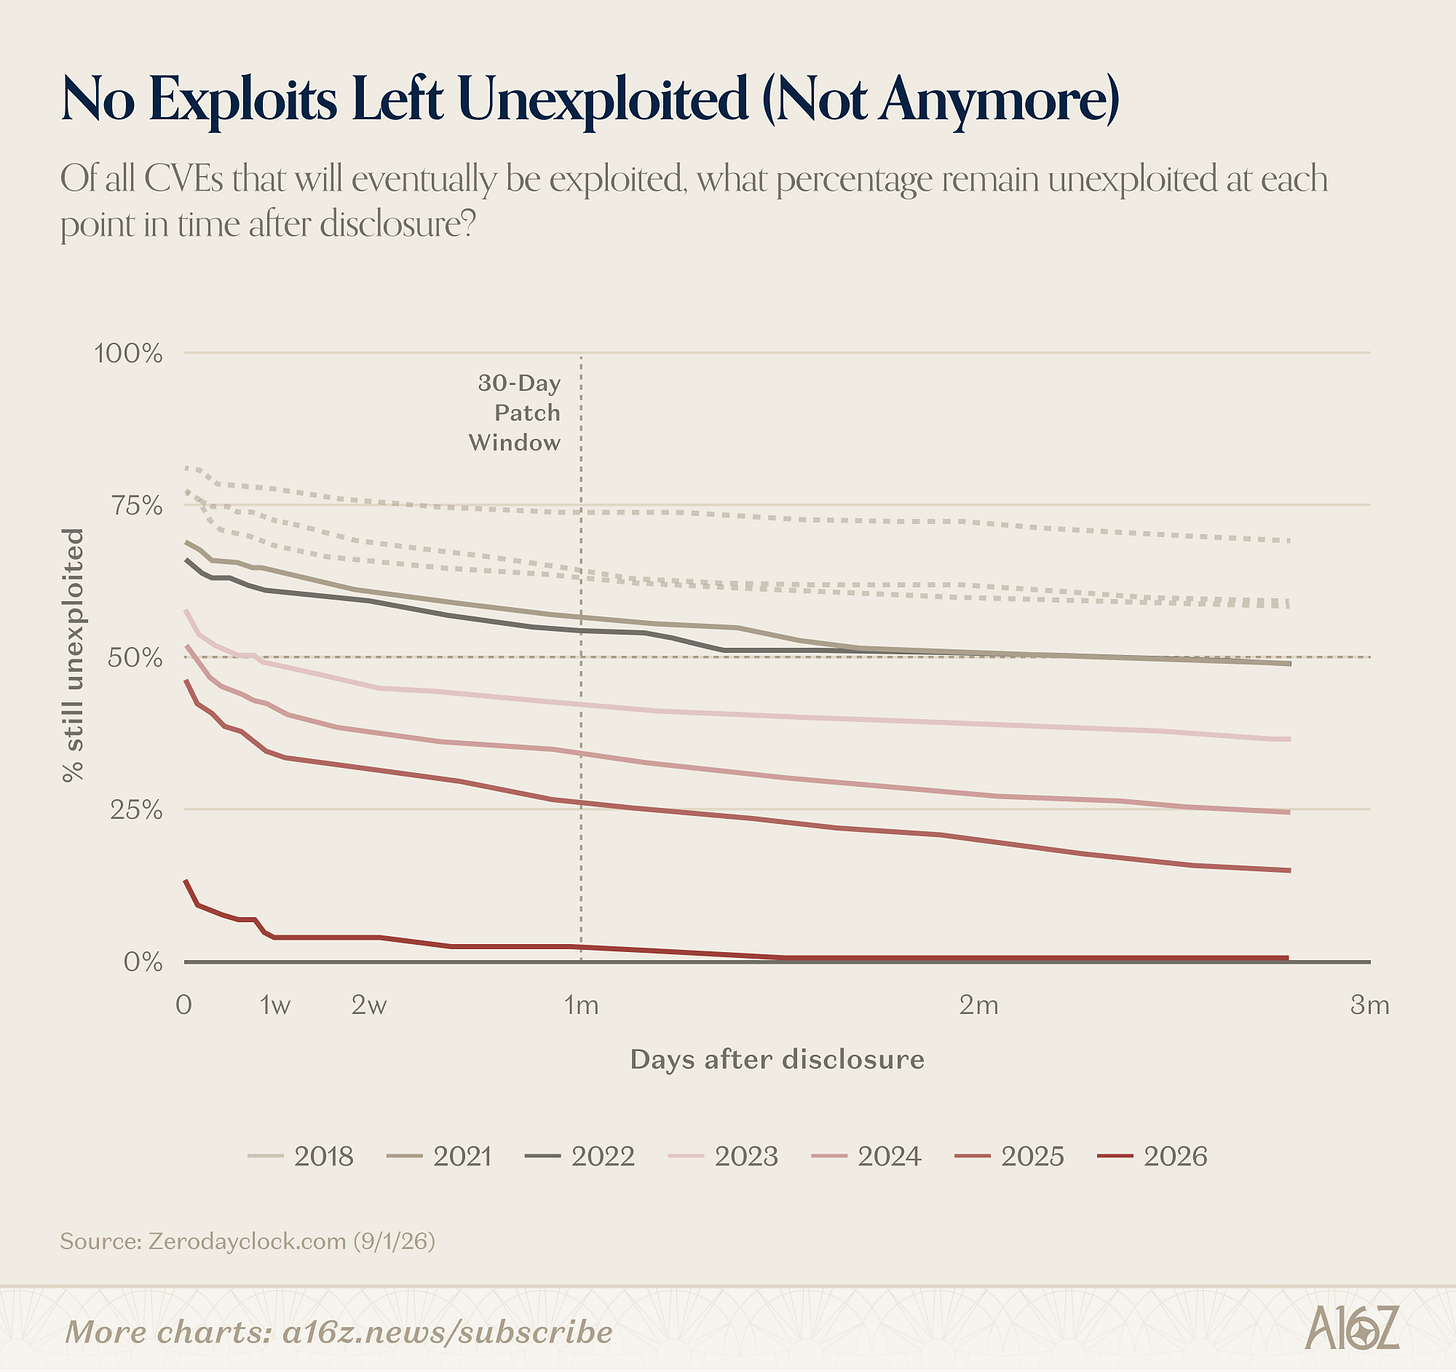
Back in 2022, a full 50% of exploits were still there for the taking after 1.5 months (and at 3 months, too), but now, if you haven’t plugged all the holes, by then, someone else will have already found them.
Clearly AI has changed the game, not only for identifying vulnerabilities, but also exploiting them. The good news is that AI will also change the game for the defense.
Either way, the urgency for cyber has intensified, and as Charts has observed before, investors are way out in front of this one:
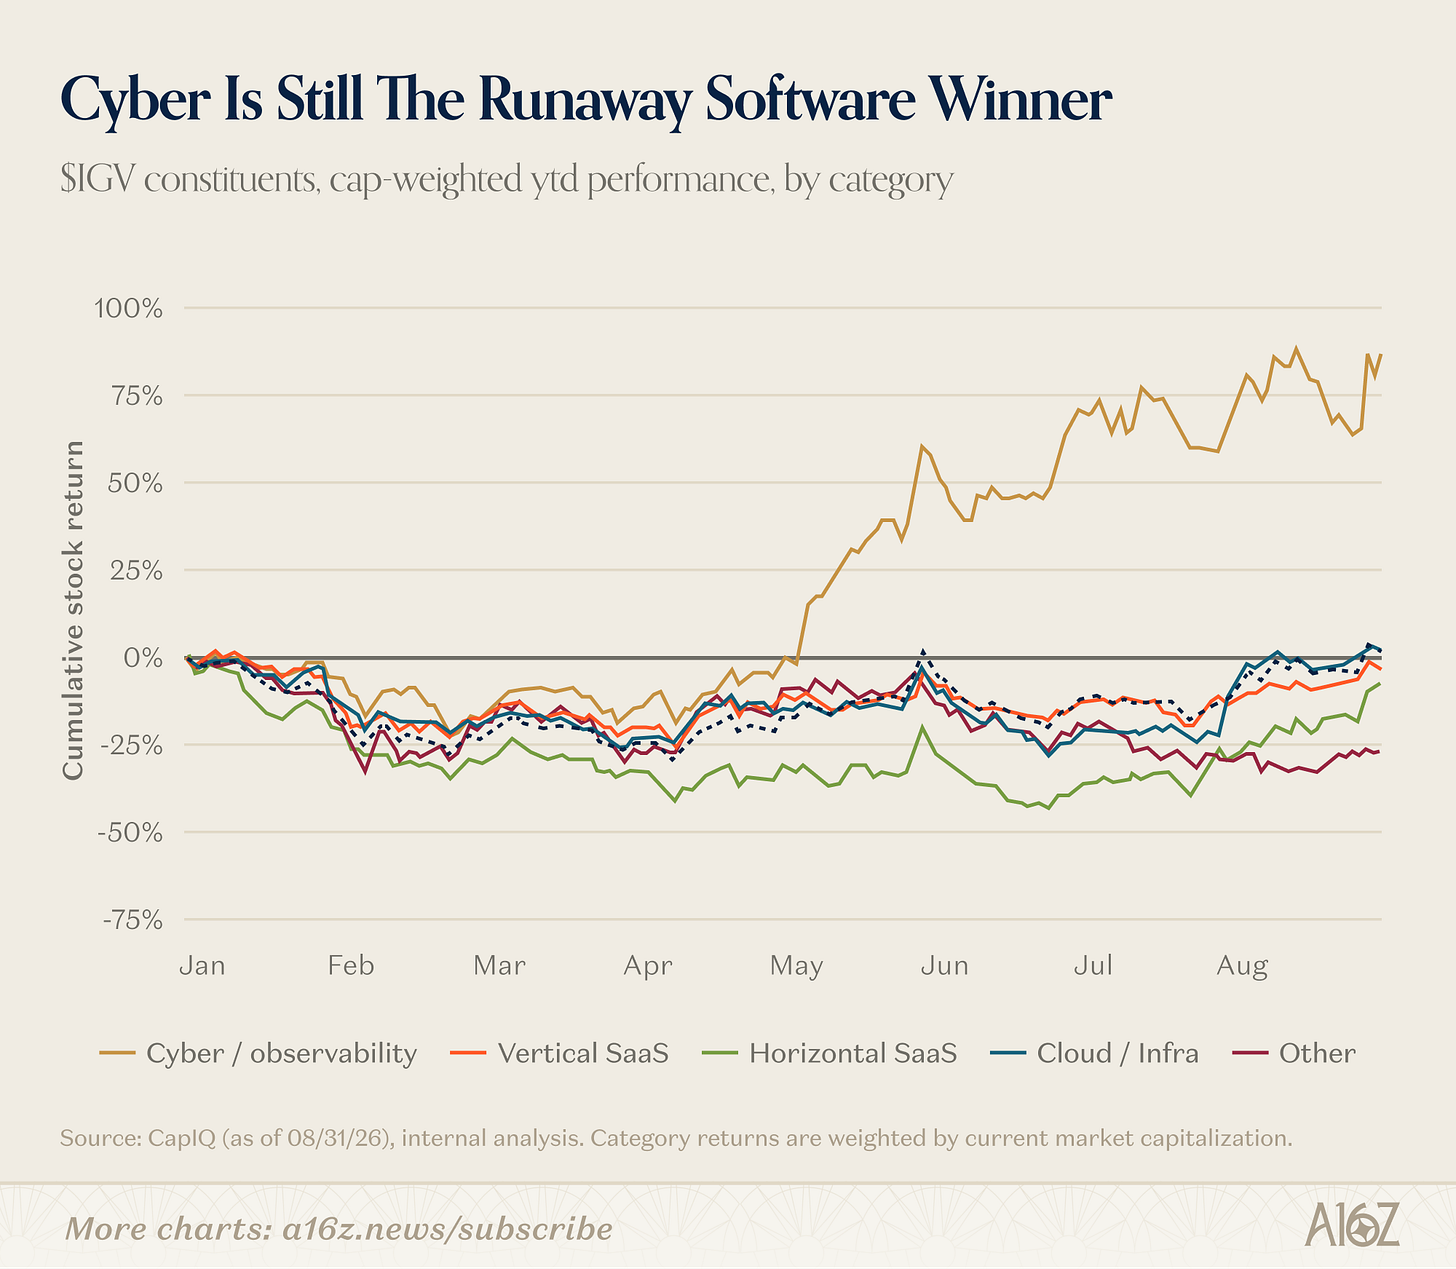
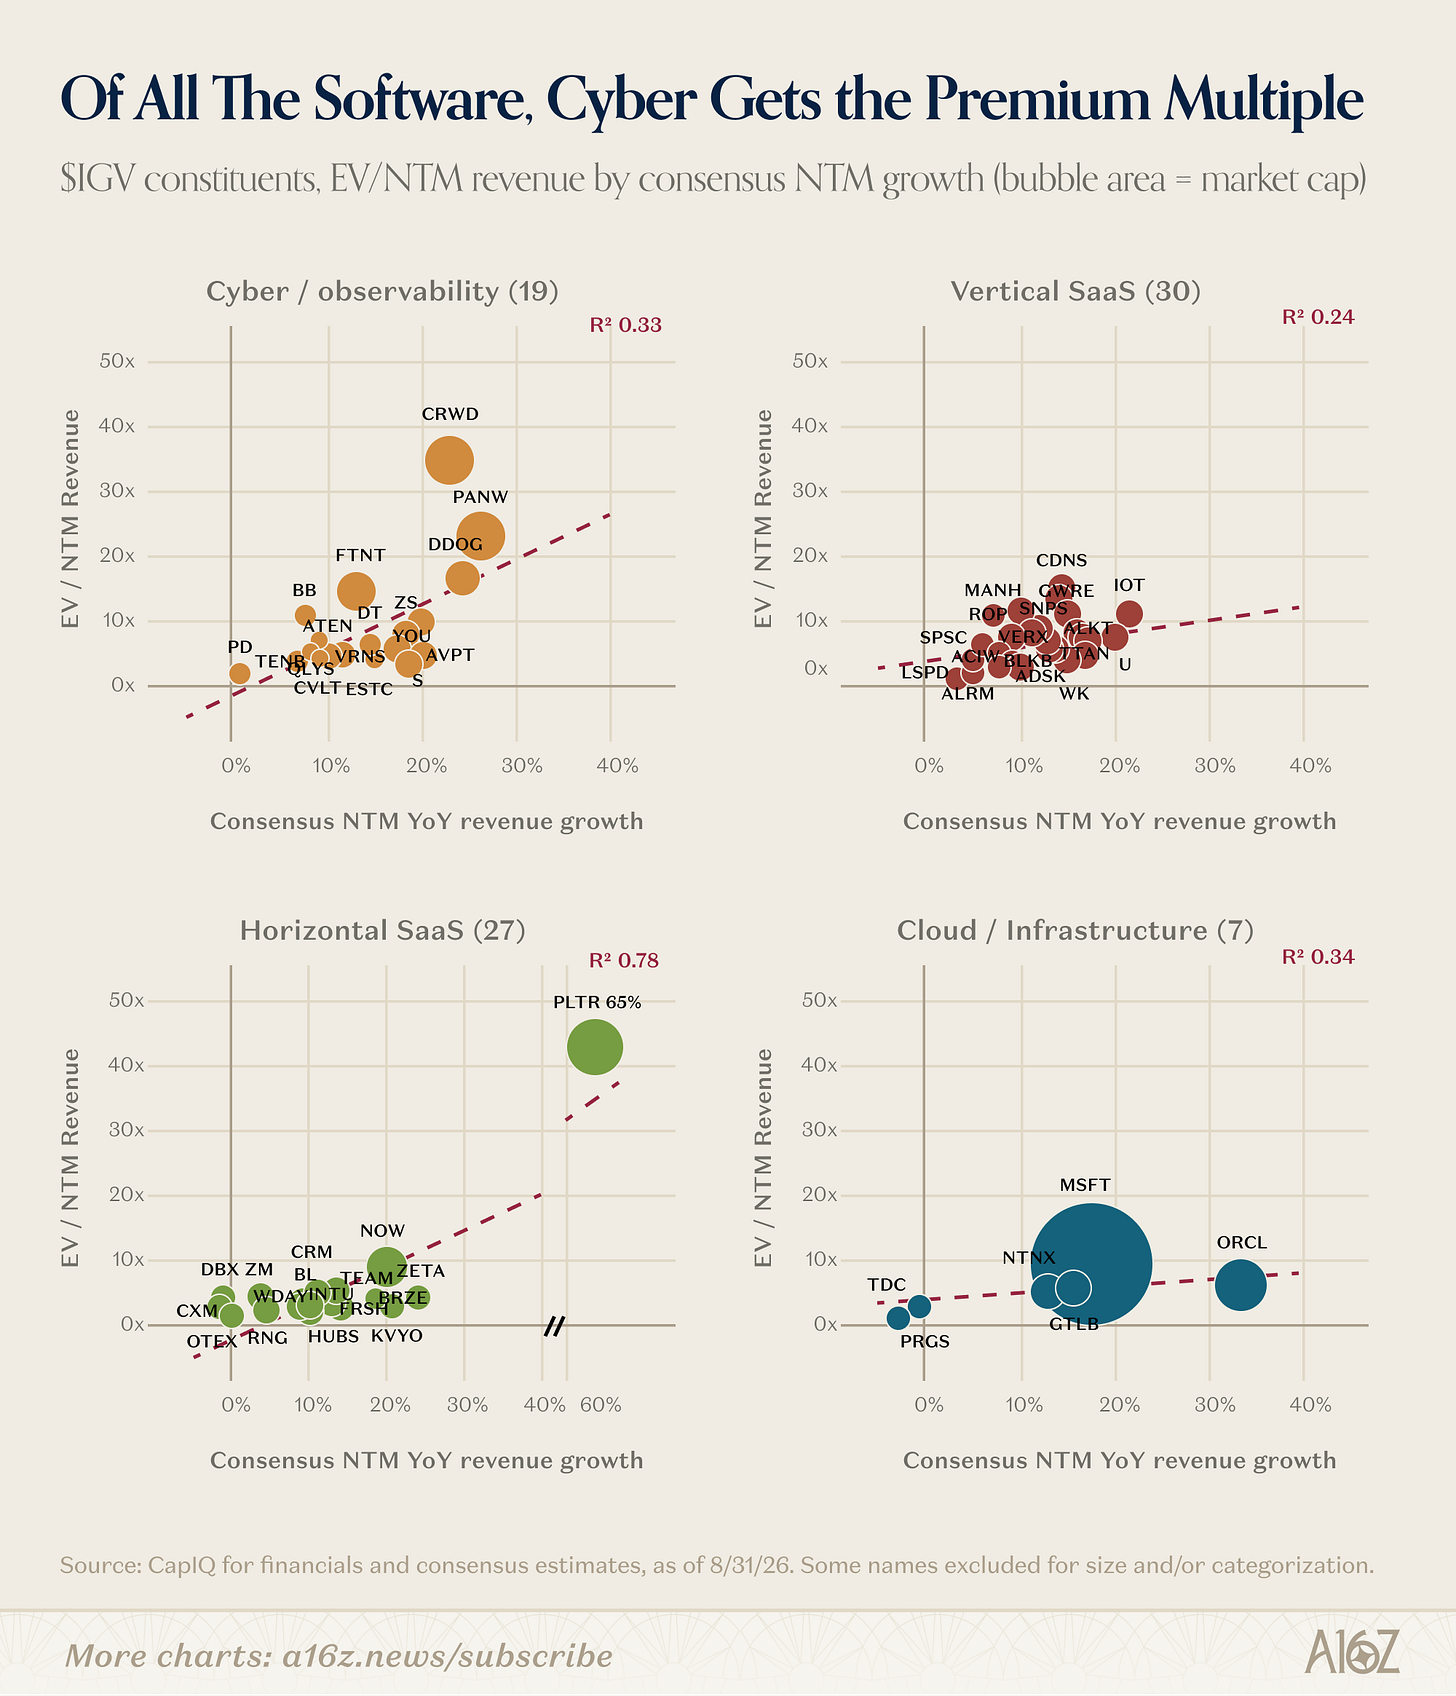
Of the $IGV constituent stocks, Cyber has massively outperformed the field, and forward revenue multiples are consistently higher, as well.
Whether and to what extent the incumbents successfully step into the breach, or whether some new cyber platforms emerge to face the challenge, remains to be seen, but there are surely going to be a whole bunch of new sheriffs in town (or else).
One final aside on the economic driver that is the AI buildout.
BLS released its latest estimate of data center construction spending, and while there was no reason to think otherwise, the pace is blistering:
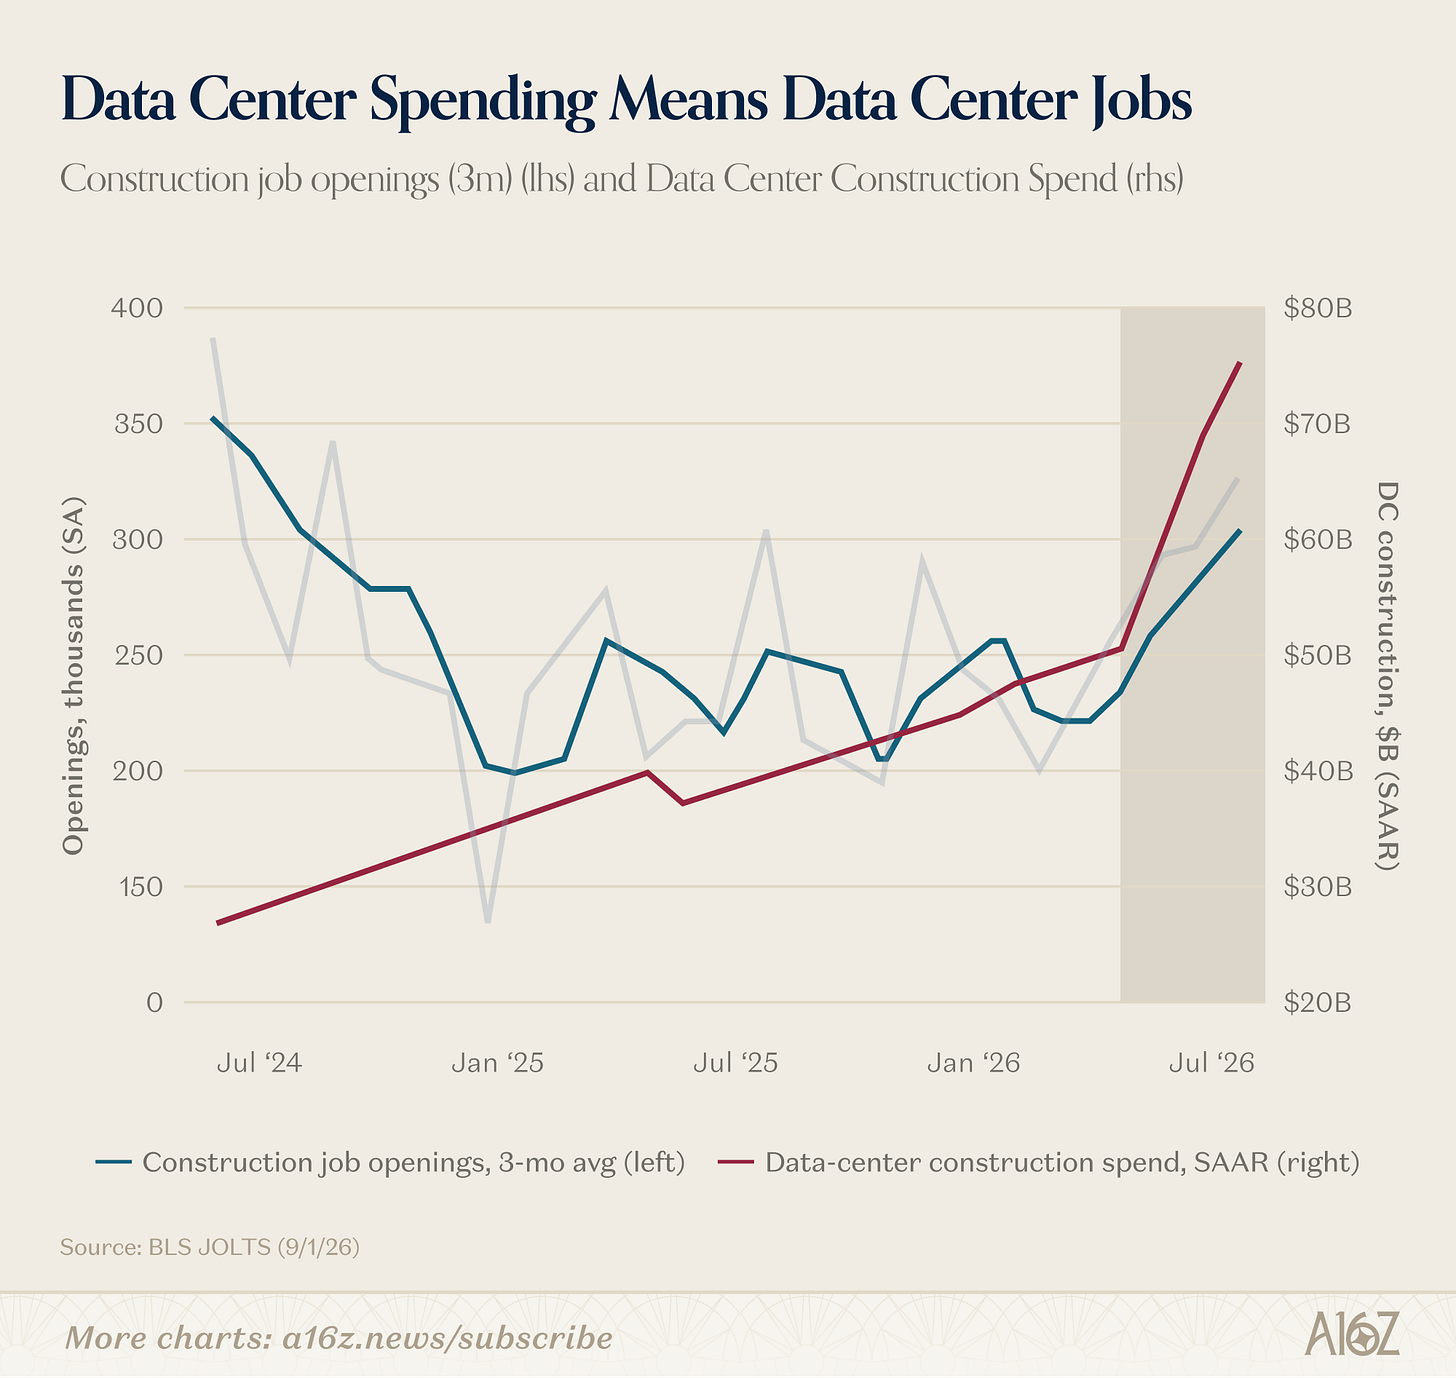
Data center construction spending jumped by ~$25B in just half a year, which is roughly the same amount it jumped over the past two years.
But, more to the point, alongside the jump in construction spending is a jump in construction job openings, which have otherwise been in steady decline since interest rates went up, and most other construction slowed substantially.
Goldman estimates that ~300,000 construction and specialty trade workers have been added to the workforce since 2022 that are attributable to the AI buildout, with nearly 75,000 of those coming in the past year alone:
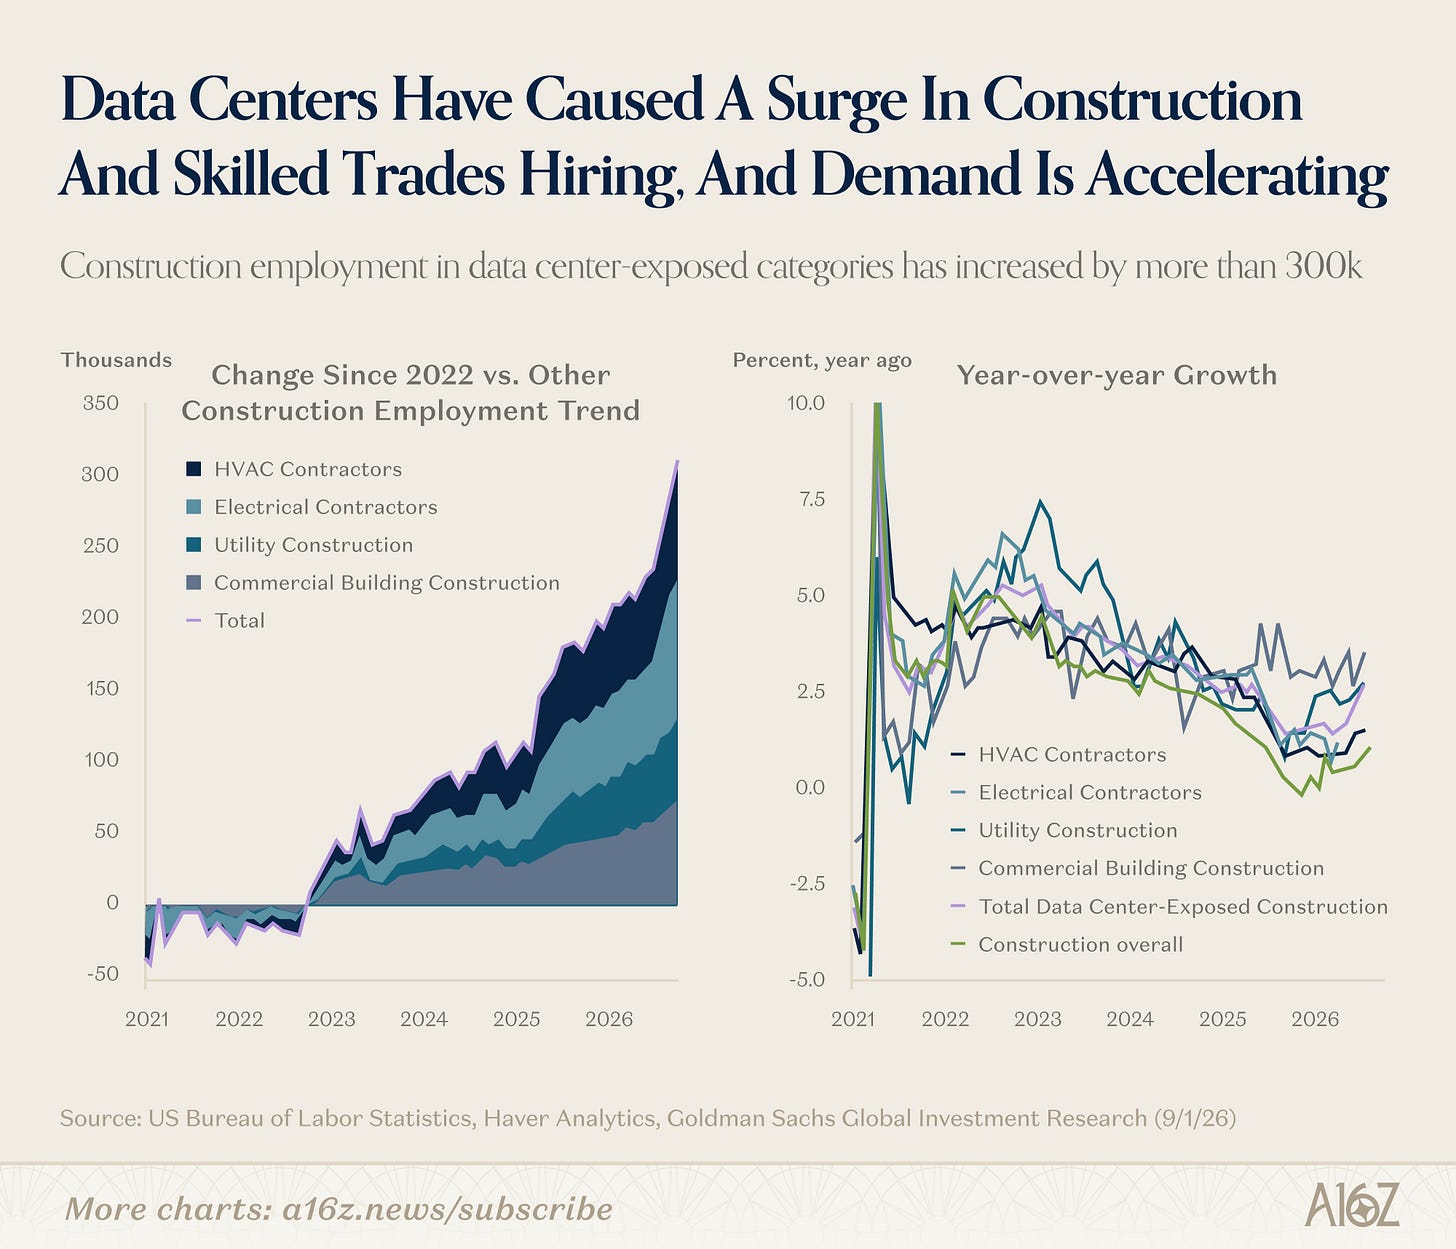
Again, while the overall trend for hard hat workers has been directionally negative since rates went up, that trend has reversed to the upside since the middle of last year.
Like ‘em or not, data centers are major jobmakers, bringing a pretty wage premium, as well—and it’s fair to say that without data centers, the employment picture, especially for blue-collar types, would be substantially worse.


This newsletter is provided for informational purposes only, and should not be relied upon as legal, business, investment, or tax advice. Furthermore, this content is not investment advice, nor is it intended for use by any investors or prospective investors in any a16z funds. This newsletter may link to other websites or contain other information obtained from third-party sources - a16z has not independently verified nor makes any representations about the current or enduring accuracy of such information. If this content includes third-party advertisements, a16z has not reviewed such advertisements and does not endorse any advertising content or related companies contained therein. Any investments or portfolio companies mentioned, referred to, or described are not representative of all investments in vehicles managed by a16z; visit https://a16z.com/investment-list/ for a full list of investments. Other important information can be found at a16z.com/disclosures. You’re receiving this newsletter since you opted in earlier; if you would like to opt out of future newsletters you may unsubscribe immediately.