
a16z 本周图表:AI 能帮你选商品,为什么还难替你下单?
17 张原始图表,读懂 AI 购物的三重阻力、TikTok Shop 的头部集中、AI 建设的成本反馈,以及美国年轻人收入与信心的反差。
AI 能帮你挑商品,谁愿意让它直接下单?
让 AI 找一双合适的跑鞋,与让它直接刷卡买下,是两次不同的授权。a16z 最新一期图表周报讨论的「Agent 购物」,就是让 AI 助手从推荐商品进一步走到代用户下单。它遇到的阻力来自三方:平台要保住客户和广告收入,商家担心买错后的退货与拒付,消费者也未必愿意交出最后的购买决定。

数据源自 Cloudflare Radar。统计对象为全体 AI bots 与 crawlers 的 HTTP 响应分布,涵盖内容抓取、模型训练与代理访问等多类行为,并非专指购物 Agent;图例写有 9.2%,但未说明其汇总方式,不能当作序列末点。
根据网络安全服务商 Cloudflare 的流量统计,各类自动化爬虫与 AI Agent在访问网络服务时,收到的「403 Forbidden」(禁止访问)状态码比例自年中以来明显增厚。这组流量也包含训练抓取和搜索等行为,无法据此算出购物 Agent 被拦了多少,更不能把全部增长归因于零售商。Cloudflare 本身就允许网站分别管理搜索、训练和代表用户访问的 Agent。a16z 提到 Amazon 等平台对购物代理收紧访问,说明能力之外还要看平台是否开放。
电商平台抵触自动化代购的核心动机首先在于防范「脱媒」。在传统模式下,消费者在站内搜索、浏览推荐列表,也会看到广告,这些访问为平台带来广告收入和直接的客户关系。如果 AI Agent充当了中介,用户只需在外部对话框确认一个最终价格,用户在平台内看推荐、看广告的机会就可能减少,客户关系也更可能由外部助手掌握。
更直接的阻力还来自交易完成后的履约与责任归属。在现实电商运营中,退货与支付纠纷早已让商家疲于应付。

数据源自全美零售联合会(NRF)与高盛。需注意原图标注为线上零售退货,但 NRF 官方口径显示 2025 年预计全零售业(线上与线下)退货商品总货值为 8,499 亿美元,线上退货率约为 19.3%;退货商品货值不等于商家的最终净损失。
根据全美零售联合会(NRF)等机构的数据梳理,退货问题在近年来愈发突出。全美零售退回的商品总额已攀升至八千亿美元上方,线上零售的退货率更是接近两成。虽然退货商品并非百分之百的净亏损,商家可以通过重新质检、翻新或折价销售收回部分成本,但双向物流、仓储盘点与包装损耗所带来的摩擦成本依然极其沉重。
当自动化代购介入时,这种摩擦可能进一步升级。如果 AI Agent因理解偏差买错了规格,或者把「寻找单价最低的商品」理解为以批发价购买了一整集装箱的袜子,谁授权了数量、谁承担买错的费用,就会成为新的争议。这里是说明风险的假设情境,并非已发生的案例。

数据源自 MRC 全球支付与欺诈报告。争议滥用 83%、盗卡 71%、退款或政策滥用 60%,均指经历过该问题的受访商户占比,不是订单欺诈率。
更严峻的现实是退单争议。商户欺诈调研显示,超过八成的受访商户遭遇过「争议滥用」(Dispute abuse),即消费者完成真实购买后,却滥用扣款争议机制。正常的退款或拒付申请本身并不等于欺诈。如果一笔 Agent 订单被说成「助手未经许可买的」,商家就需要证明授权。若发卡行最终支持买家的争议,商家可能被追回货款。
不仅平台和商家心存疑虑,消费者自己对完全交出购买控制权同样缺乏足够信任。

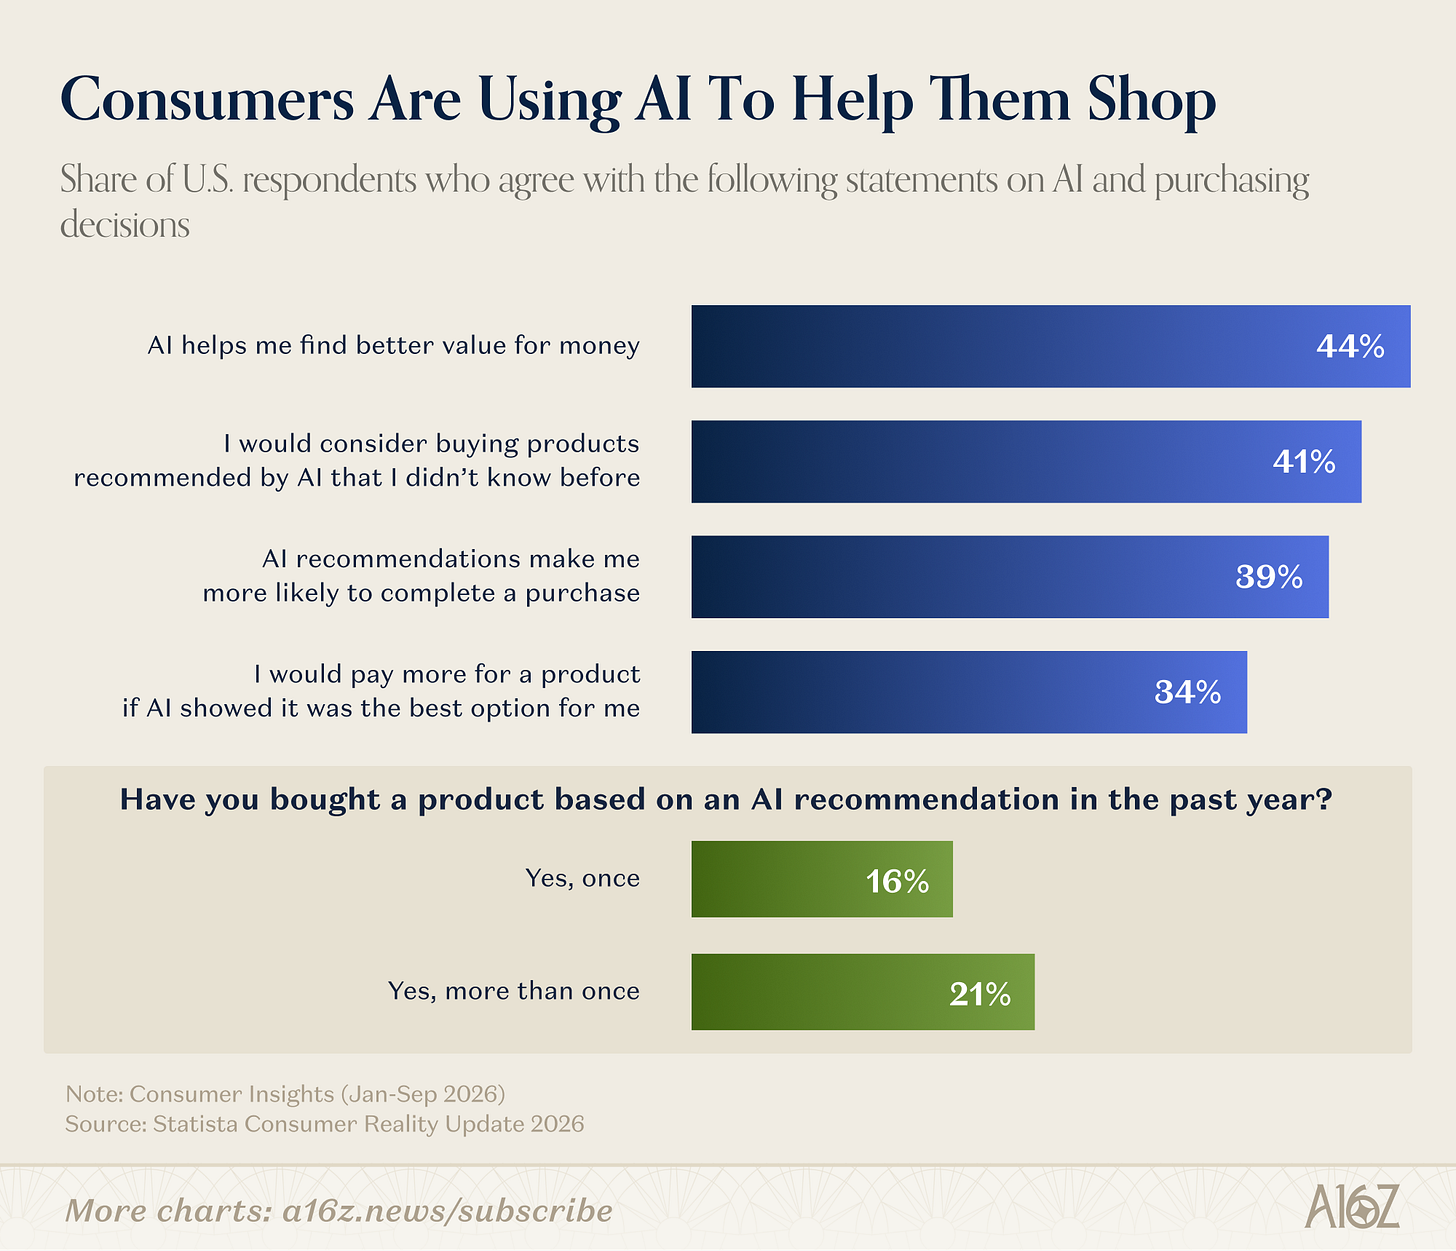
数据源自 Statista Consumer Reality Update。展示美国受访者同意各陈述的独立比例;其中过去一年基于 AI 推荐购买一次(16%)与多次(21%)合计为 37%。
调研显示,消费者并非排斥 AI 参与购物。44% 的受访者认可 AI 能帮助找到更划算的商品,41% 愿意考虑此前未知但由 AI 推荐的商品,37% 的受访者过去一年曾基于 AI 推荐完成购买。如果 AI 向他们展示某款产品是最佳选择,也有超过三成的消费者表示愿意为此多付一点溢价。
然而,一旦把任务从「帮我找」升级为「替我买」,态度便出现了清晰的分水岭。

数据源自 Statista 调研。各品类代购意愿在两成多徘徊,奢侈品代购意愿更低(16%),42% 表示不信任 AI 代购任何商品;这仍未达到受访者的一半。
面对是否愿意让 AI 挑选并直接代购的选项,约 42% 的受访者明确表示不信任 AI 替自己做最终购买决策。即便是日用品、服装或数码配件,愿意放权代购的比例也仅在四分之一上下。愿意听建议,并不等于愿意把刷卡权交给助手;两者之间还有一层信任需要建立。
点击流数据还显示,AI 在购物过程中更常出现在做比较的位置。

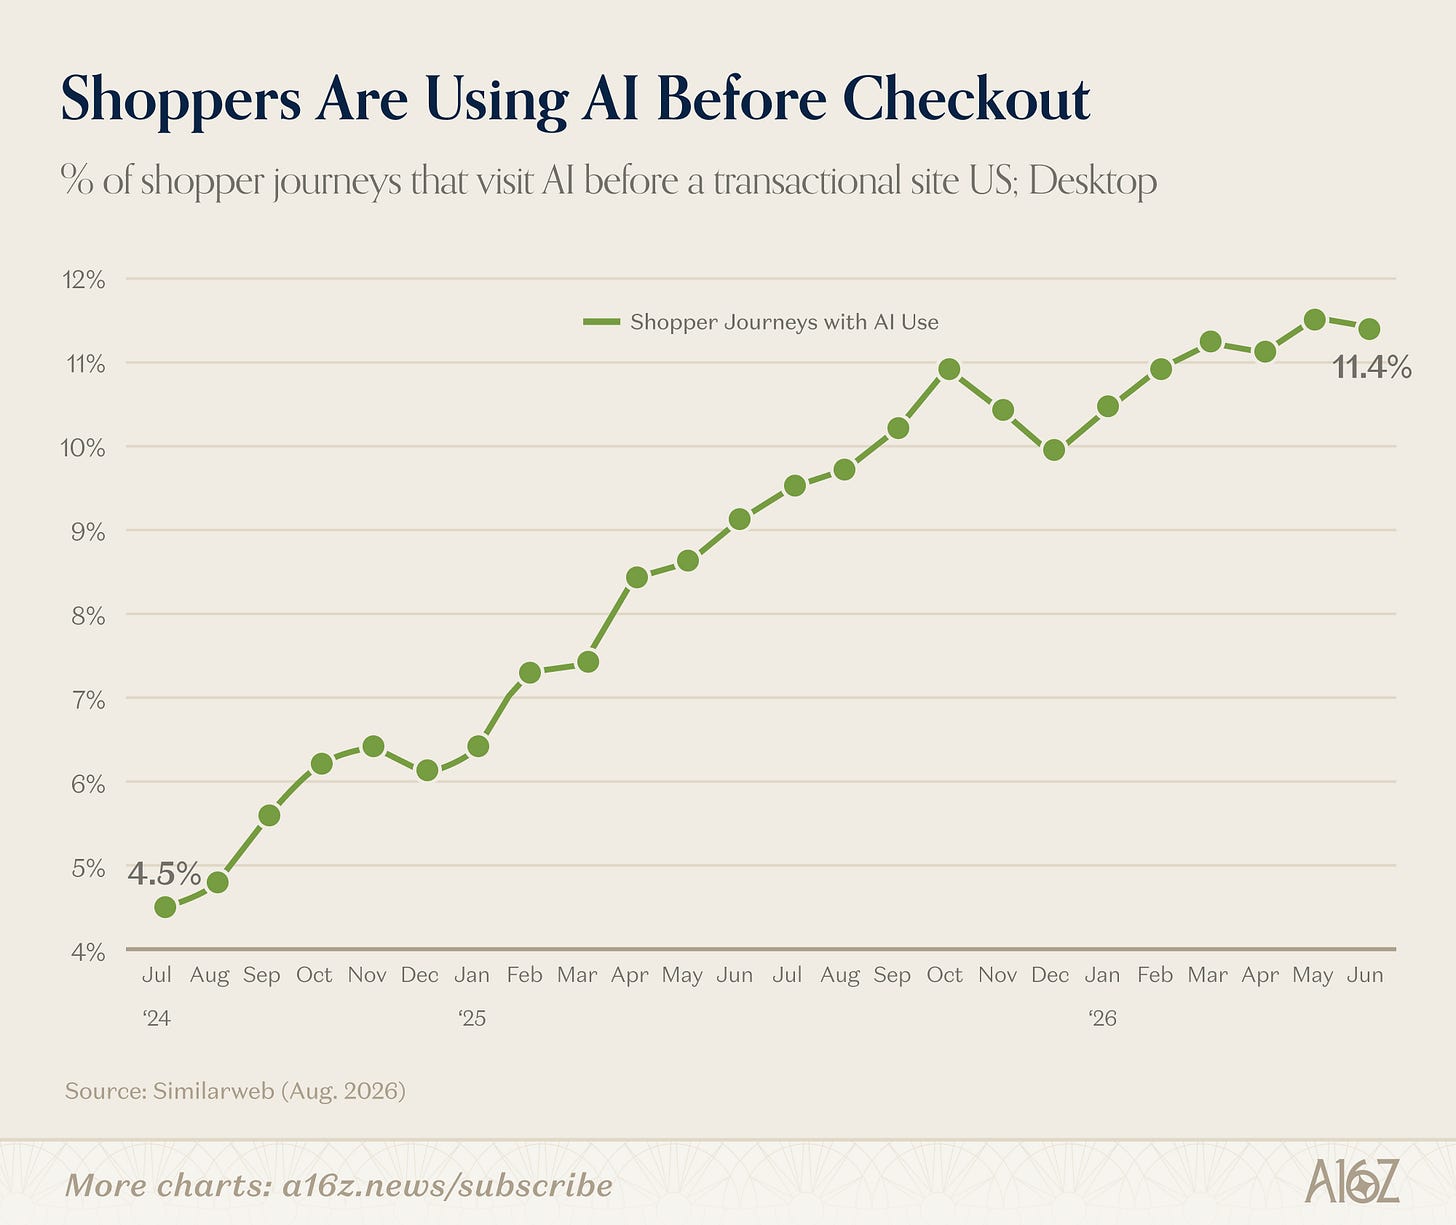
数据源自 Similarweb,仅覆盖美国桌面端会话,数据截至年中。展示的是到达交易网站前访问过 AI 的旅程比例,不等于 AI 成交率或自动支付率。
根据 Similarweb 对美国桌面端用户点击流的分析,在到达交易网站之前访问过 AI 的购物旅程比例,在近两年的时间里从 4.5% 爬升到了 11.4%。这说明,在该美国桌面样本中,购物前咨询 AI 变得更常见。数据截至六月,不能直接当成此刻所有设备上的购物习惯。

数据源自 Similarweb(统计对象各自为使用过该工具的桌面端会话)。同一会话中多次使用使各项比例不互斥;AI 76.1% 集中在中间对比,首触点为 23.2%,末触点为 18.4%。
在用过 AI 的购物会话中,76.1% 在旅程中间使用过它。这与做功课、比较型号的用途相吻合,但触点位置本身并不能证明每个人当时具体问了什么。相比之下,以 AI 为首个触点的比例仅占 23.2%,而将 AI 作为进入交易前的最后触点的比例也只有 18.4%。对比来看,搜索在对应会话的首、中、末触点比例分别为 50.0%、59.5% 和 56.2%,说明搜索在开始和临近交易时也常出现。但两者的分母是各自用过该工具的会话,不能把两个样本比例直接相减当作取代率;且同一会话可多次使用工具,首中末比例不可加成 100%。
这就给商业化带来了一个极其棘手的难题:广告归因。如果消费者是在社交媒体上被种草,然后打开 AI 进行多方参数比对,最后又换到手机端或独立网站完成支付,那么这笔交易究竟该记在谁的功劳簿上?这种跨平台、跨周期的决策断层,使得商家很难衡量在 AI 渠道投放预算的直接回报。
美国桌面端,分别以用过 AI、用过搜索的会话为分母。三项可重叠,不是一层层减少的转化漏斗。
中间环节使用 AI 的会话较多,搜索在首尾触点也常见。最后触点只是到达交易网站前的一次访问,不表示由 AI 自动支付。来源:a16z 所引 Similarweb 图表。
商业基础设施的完善与算法能力的演进或许会在未来逐步解决支付鉴权、退换货规则与归因协议等问题,但就当下而言,这组数据里的 AI 更常承担购物咨询,离普遍获得自主购买权仍有距离。
TikTok Shop:少数卖家拿走大多数销售额
TikTok Shop 的购物常从一段视频开始:展示效果、讲解用法或创作者的推荐,先让人产生购买兴趣。对照 Agent 帮人比较商品的路径,这种社交电商提醒我们,购物还包含发现、信任和观看体验。它的销售分配也高度集中。

数据源自 Marketplace Pulse。按卖家自营账号累计视频量分组,视频数量不含合作达人的带货视频(Affiliate),且视频与粉丝数据仅覆盖 71% 的被追踪卖家。8.4% 的高产卖家获得了所分析样本 60.3% 的销售份额。
根据 Marketplace Pulse 对 TikTok Shop 超过十五万家商户与数百万件商品的跟踪分析,店铺自身的内容产出规模与销售业绩存在强烈的正向关联。在视频与粉丝数据覆盖的 71% 被追踪卖家群体中,发布了超过 1000 条自营视频的卖家仅占总数的 8.4%,但这批高产卖家占该分组样本 60.3% 的销售额。相比之下,发布 0 至 10 条视频的卖家虽然占了两成以上,销售贡献却微乎其微。
视频数量只计入「店铺自营账号」发布的视频资产,未包含外部达人带货(Affiliate)内容,但这并不等于销售额排除了达人的贡献。高频发布视频与销售规模具有强相关性,但这并不意味着任何卖家只要机械性地堆砌 1000 条视频就必然能换来同等规模的收入增长。
再按样本卖家的累计销售额排名,头部集中程度更为明显。

数据源自 Marketplace Pulse。累计销售额由销量件数乘平均标价估算,单价上限 300 美元并剔除了 16% 缺少价格数据的卖家;若按售出件数统计,前 1% 卖家占 49%。前 1% 卖家贡献 58.9%,前 10% 卖家合计占据 93.3%。
按估算累计销售额排名,头部 0.1% 的顶尖卖家(约一百余家)独占了所分析样本近四分之一(24.7%)的估算累计销售额。如果把范围扩大到前 1%,其销售份额进一步攀升至 58.9%;而前 10% 的卖家占据了所分析样本 93.3% 的估算累计销售额。排在后 50% 的海量尾部卖家,合计瓜分到的销售额份额仅有 0.1%。金额份额按售出件数乘平均标价估算,平均标价以 300 美元为上限,并剔除了 16% 缺少价格数据的卖家。改按售出件数排名,前 1% 卖家占 49%。
这里有两个容易混淆的「约 60%」:一个是前述发布了 1000 条以上自营视频的 8.4% 卖家组,拿下了所分析样本 60.3% 的销售额;另一个则是按估算累计销售额排名的前 1% 卖家,贡献了所分析样本 58.9% 的估算累计销售额。这是两种不同分组下的统计结果,不可相互替代。
发布 1000+ 条视频
占该样本 60.3% 销售额
不按视频量筛选
合计占 58.9% 销售额
选择累计销售额榜上的卖家范围,观察份额如何累加。
| 卖家分层 | 本层销售额份额 |
|---|---|
| 前 0.1% | 24.7% |
| 接下来的 0.9% | 34.2% |
| 接下来的 9% | 34.4% |
| 接下来的 40% | 6.5% |
| 后 50% | 0.1% |
来源:Marketplace Pulse,经 a16z 图表呈现。累计销售额按件数与平均标价估算,单价上限为 300 美元,剔除了 16% 缺少价格数据的卖家;四舍五入后各层合计 99.9%。这两种分组不能视作同一批卖家。
高度集中也不代表头部位置稳固。Marketplace Pulse 发现,单月活跃榜与累计榜差别很大,一次走红与持续留在头部是两回事。与此同时,如果未来更多购买决策被交给 Agent,那些靠高频视频打动人、说服人的头部创作者与卖家,其优势未必能继续以同样方式发挥作用。这仍是一个开放问题。内容让人想买,Agent 帮人比较,两种作用可以出现在同一趟购物旅程里,Agent 购物与社交电商并不必然互相取代。
AI 建设越来越贵,谁会先缩减需求?
商品市场中有句流传已久的谚语:「治愈高价的良药就是高价本身」(The cure to high prices is high prices)。当某种商品的价格涨得足够高,高昂的成本就会自然抑制下游的需求;需求减弱后,价格进一步上涨的压力可能减轻。这个反馈需要时间,也受供给、库存等因素影响。
AI 建设中的两组数据,让 a16z 想到了这条供需规律:元件价格和电脑出货,以及融资价格和新增借款。

数据源自美国劳工统计局(BLS)生产者价格指数(PPI)。反映的是计算机与电子设备制造厂商在采购元件时面临的价格通胀,并不等同于单一 GPU 或零售电脑的直接提价幅度。
AI 建设增加了对芯片和电子元件的需求,也给供应链带来涨价压力。美国劳工统计局的数据显示,半导体及其它电子元器件的生产者价格指数(PPI)同比涨幅自往常平稳的区间急剧拉升,近期同比增速超过了 25%。
云厂商对核心算力芯片的抢购并未受短期高价阻碍,反而还在上调资本开支预测。上调的预算中,一部分可能用于覆盖更贵的元件成本;预算更多,并不等于买到同比例更多的设备。元件涨价也可能影响普通消费电子市场:在云厂商继续大举采购的同时,个人和企业买家可能推迟换机。

数据源自 IDC。左侧为主要厂商出货量堆叠,右侧为同比变动;出货走低可能综合受价格传导、前期库存周期与宏观支出意愿影响。
根据 IDC 的季度追踪,全球个人电脑(PC)出货量在经历了前期的温和复苏后,近期同比增速显著跌入负增长区间,最近两季在图中分别约为 -4% 和 -20%。如果元件涨价传到整机售价,个人和企业就可能延后换电脑。不过,出货下降也可能受提前备货、库存或供给约束影响;这两张图没有单独识别价格的作用。
类似的供求反馈不仅发生在实体硬件上,也正在金融资本市场逐步显现。随着数据中心与能源设施的建设规模越来越庞大,债券等借款方式越来越多地被用于为建设筹资。

数据源自英国金融时报、ICE 与彭博社。纵轴为 15 年期以上债券相对同期限美国国债的利差溢价(百分点),并非债券的名义总票息;科技指数评级包含 A1 至 BBB3,而对比组为 AAA 至 A 级的高评级企业债。
借款的价格也出现了变化。15 年期以上的科技行业债券相对国债的风险溢价(信用利差),在发债潮开启后逐步与普通高等级企业债拉开差距,利差攀升至 1.2 到 1.3 个百分点。两个指数的信用评级并不相同,信用风险和市场预期也会影响差距,不能把它全部算到 AI 发债增加头上。
融资变贵可能让借款人重新考虑时机,随后出现的发行量回落与这种解释相符。

数据源自摩根士丹利与金融时报统计。反映的是每月新发行的借款规模(流量),而非存量总额;单月发行量下降不等于债务存量下降。
全球信贷市场中与 AI 相关的债务发行量在年中一度超过千亿美元的单月峰值,随后走低,九月约为八月的一半。融资成本可能是原因之一,但发行安排和项目进度也能改变月度数字。
a16z 提出的可能性是:高价未必先让最积极建设 AI 的厂商停手,却可能先让普通买家推迟换机、让融资放慢。需求减弱能否进一步拉低价格,这些数据还没有给出答案。
美国年轻人收入更高,为什么信心更低?
在公众的普遍印象中,以 Z 世代(Gen Z)为代表的年轻人群体往往被描绘为深受通胀侵蚀、就业压力重重的困难一代。然而,银行机构依据微观财务数据给出的画像,却与这种流行叙事存在着巨大的偏差。

数据源自 PNC 银行对美国人口普查局 CPS ASEC 微观数据的测算。经个人消费支出物价指数(PCE)剔除通胀后,对比的是两代人在同处于 19–27 岁时的历史水平,而非两代人在当下的绝对收入对比。
PNC 银行的经济分析报告指出,如果将处于 19 至 27 岁阶段的当今 Z 世代(2025 年)与十年前处于相同年龄阶段的千禧一代(2015 年)进行横向比较,经通胀调整后的实际收入不仅没有下降,反而高出了 20% 至 40%。无论是在低收入底层、中位数水平还是高收入阶层,年轻一代的收入水平都优于当年刚刚走出全球金融危机阴影的千禧一代。不仅如此,在 PNC 各项同龄维度的比较中,年轻一代的就业与早期资产状况也更好:就业更充分、失业率更低,净资产更高,持有退休账户的比例也明显更高。
然而,更高的收入并未转化出丰裕的日常现金缓冲。

数据源自 PNC 内部银行账户数据。储蓄缓冲天数指如果收入突然中断,现有活期与储蓄存款能按当前消费水平维持的天数。
银行内部流水数据显示,Z 世代将月收入的 66% 用于日常支出与信用卡偿还,高于当年千禧一代的 60%;而其存款账户中的流动备用金,仅足以在收入中断后支撑 25 天的日常消费,低于千禧一代同期的 32 天。
在具体的资金去向与消费篮子中,支出结构的变动同样呈现出分化。

左图数据源自美国劳工统计局消费支出调查(BLS CES 25 岁以下家庭);右图源自 PNC 银行卡交易类别份额变动。注意百分比点(pp)变动代表在总支出中的权重增减,并非单纯消费金额的绝对增长率。
在宏观支出调查中,25 岁以下年轻家庭在退休储蓄(+2.3 个百分点)、住房开支(+1.5 个百分点)与交通(+1.4 个百分点)上的总预算份额有所提高,而教育份额下降(-2.3 个百分点),公用事业份额也出现缩减(-1.2 个百分点)。在右侧按类别统计的刷卡支出份额中,赌博(+3.0pp)与电子家电(+2.4pp)的占比抬升最为突出,而食品饮料零售(-3.8pp)与服饰(-2.0pp)的占比收缩最为明显。这些数字是支出份额的变化,不是花费金额的增速。左图基于 BLS 家庭总预算,右图基于 PNC 银行卡交易支出,两者统计分母不同,不可合并计算。
现金缓冲与退休储蓄衡量的是两件事:今天能应付多久的支出,与为退休存了多少,可以朝不同方向变化。收入和早期资产积累更好,也没有让年轻人更乐观。

数据源自 PNC 与密歇根大学消费者信心调查。展示的是 18–34 岁分项指数减去总体指数的点差;历史上该数值长期保持在 +5 到 +15 的正向区间。
在密歇根大学长达数十年维度的消费者信心跟踪中,18 至 34 岁群体的信心通常高于总体,长期享有 5 到 15 个点的「青年信心溢价」。然而自 2017 年以来,这种传统溢价几乎消耗殆尽,近期甚至多次跌破零轴,即该年龄组的信心低于总体。这组年龄范围并不完全等同于整个 Z 世代。a16z 也提醒,消费者信心调查本身噪声较大,回应率的变化同样可能影响读数,但相比单期绝对数值,更值得关注的是年轻人相对总体走势的长期变化。
为什么拿着明显更高的实际收入,年轻一代反而更感到迷茫?
a16z 周报倾向于认为,收入和资产更好,悲观情绪就很难归因于财务。但 PNC 原报告保留了一个关键例外:买房的门槛更高了。
根据 PNC 报告中的核心测算,如果按照一套全美中位数价格的房屋并结合当期抵押贷款利率计算,购买一套住房的月供支出在如今需要占到一个 25 至 26 岁年轻人中位收入的 65%;而在十年前,同一测算模型下同龄千禧一代承担的理论月供占比仅为 39%。
这里计算的是购买中位价房屋的负担,并非年轻人实际房贷还款占比。即使工资跑赢一般消费物价,只要房价和房贷成本涨得更快,买房这个长期目标仍可能更遥远。
收入比较为 19–27 岁;房贷测算为 25–26 岁;信心为 18–34 岁相对总体。各项保留自己的比较范围。
PNC 将住房负担与持续通胀视为信心走弱的重要原因。这为「赚得更多却不更乐观」提供了一种有数据支持的解释,也提醒我们:判断生活是否改善,要同时看收入、能动用的现金,以及长期目标的成本。
购物有平台规则和授权,内容有注意力与信任,建设有元件和融资成本,收入还要面对住房负担。技术能把一些事情做得更快,这些图表追问的则是:谁愿意使用、谁承担费用,以及最终的收益怎样落到人身上。
AI 能帮你挑商品,谁愿意让它直接下单?
让 AI 找一双合适的跑鞋,与让它直接刷卡买下,是两次不同的授权。a16z 最新一期图表周报讨论的「Agent 购物」,就是让 AI 助手从推荐商品进一步走到代用户下单。它遇到的阻力来自三方:平台要保住客户和广告收入,商家担心买错后的退货与拒付,消费者也未必愿意交出最后的购买决定。
TikTok Shop 的购物常从视频展示效果、讲解用法开始,提醒我们购物还包含发现、观看与信任。它的销售额分配高度集中;这与 Agent 辅助比较是两种可以同时出现的作用。
「治愈高价的良药就是高价本身」:成本太高可能压低需求,随后减轻涨价压力。AI 元件与融资数据与这种反馈相符,但尚未单独识别因果,也未证明价格已回落。
云厂商仍上调资本开支预测,但部分预算可能只是在支付更贵的元件;钱更多,不等于设备同比例更多。高价可能先让普通买家和融资放慢,能否带来降价仍待观察。
反常的落差同样出现在美国年轻一代身上。PNC 银行微观数据显示,19–27 岁的 Z 世代经通胀调整后的实际收入比十年前同龄千禧一代高出 20% 至 40%,失业率更低,净资产与退休账户持有率也更优。然而,其日常支出与信用卡偿还占月收入的 66%,流动应急存款仅够支撑 25 天;密歇根大学长期跟踪中,18–34 岁群体的青年信心溢价已几乎荡然无存。
This Week in Charts: Agents Denied
Super-Pareto TikTok Shop; Cure to High Prices is High Prices; Zoomers Living Large?


Agentic commerce is a thing. Muse and others advanced the timeline to “agentic commerce is here right now—it was nice knowing you, old-school ecomm” but then more recently, some big etailers (like Amazon) responded, “not so fast—agent shoppers are officially instablocked.”
Now, the battle between what agents and bots can do vs. what the rest of the internet will allow them to do has been going on for some time, but the recent escalation does appear to show up in the data:
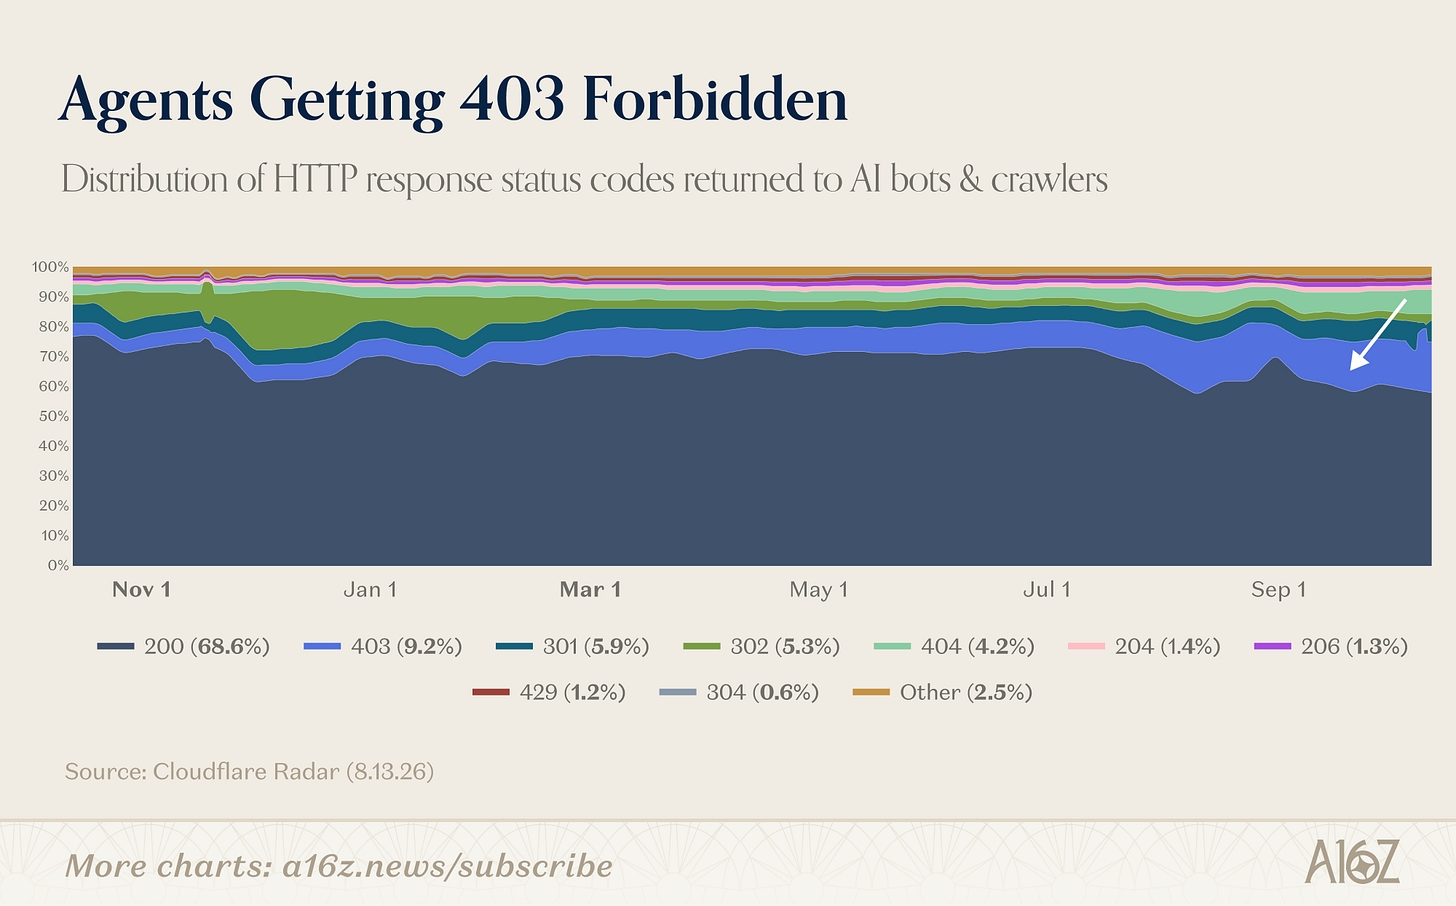
According to data from Cloudflare, the share of 403 “Forbidden” responses received by agents and bots has fattened considerably since the summer (and is ~double what it once was).
Whether that’s a response specifically to “agentic commerce” is a separate question, but presumably that’s at least some part of what’s going on. Etailers understandably don’t want to be disintermediated, and not only lose their customer relationships, but also lose those customer eyeballs that are a substantial source of advertising revenue for the large ecomm platforms.
There are likely other reasons why the Amazons of the world are apprehensive about agentic commerce, beyond simply eroding their platform advantages. First among those other concerns are likely fraud and returns, both of which have been a rising plague for ecomm more broadly:
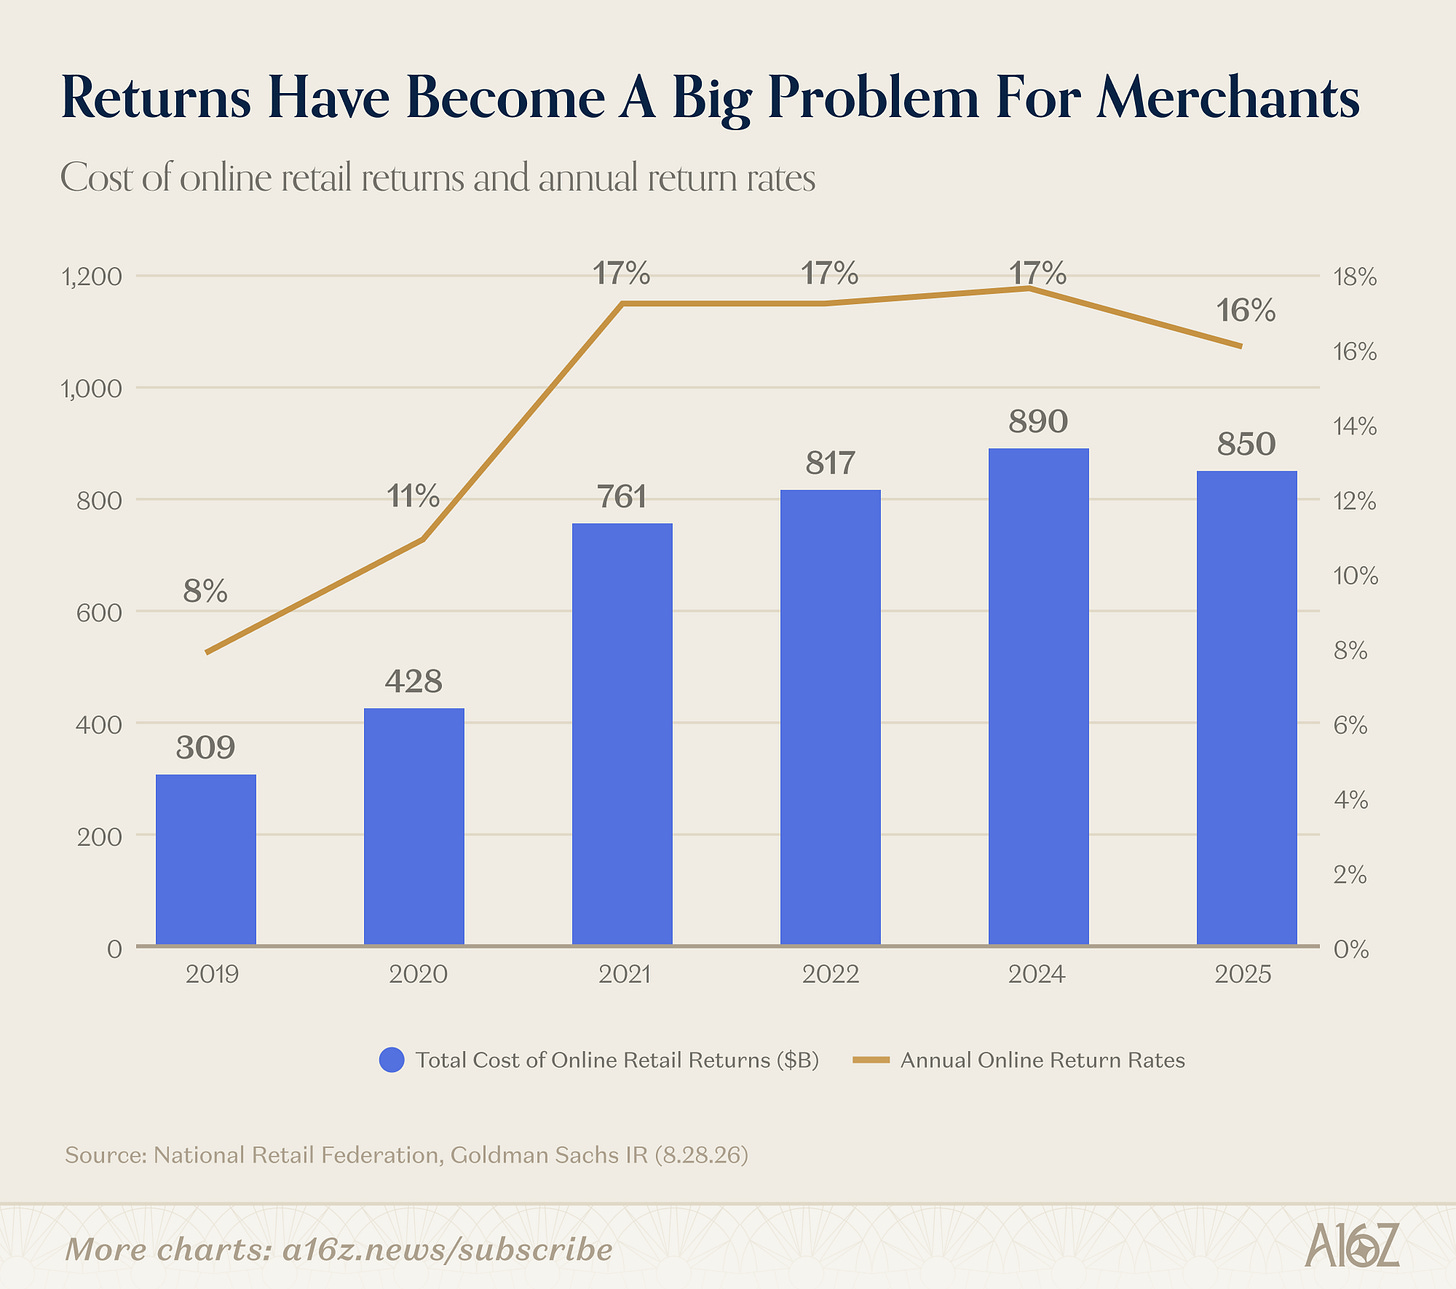
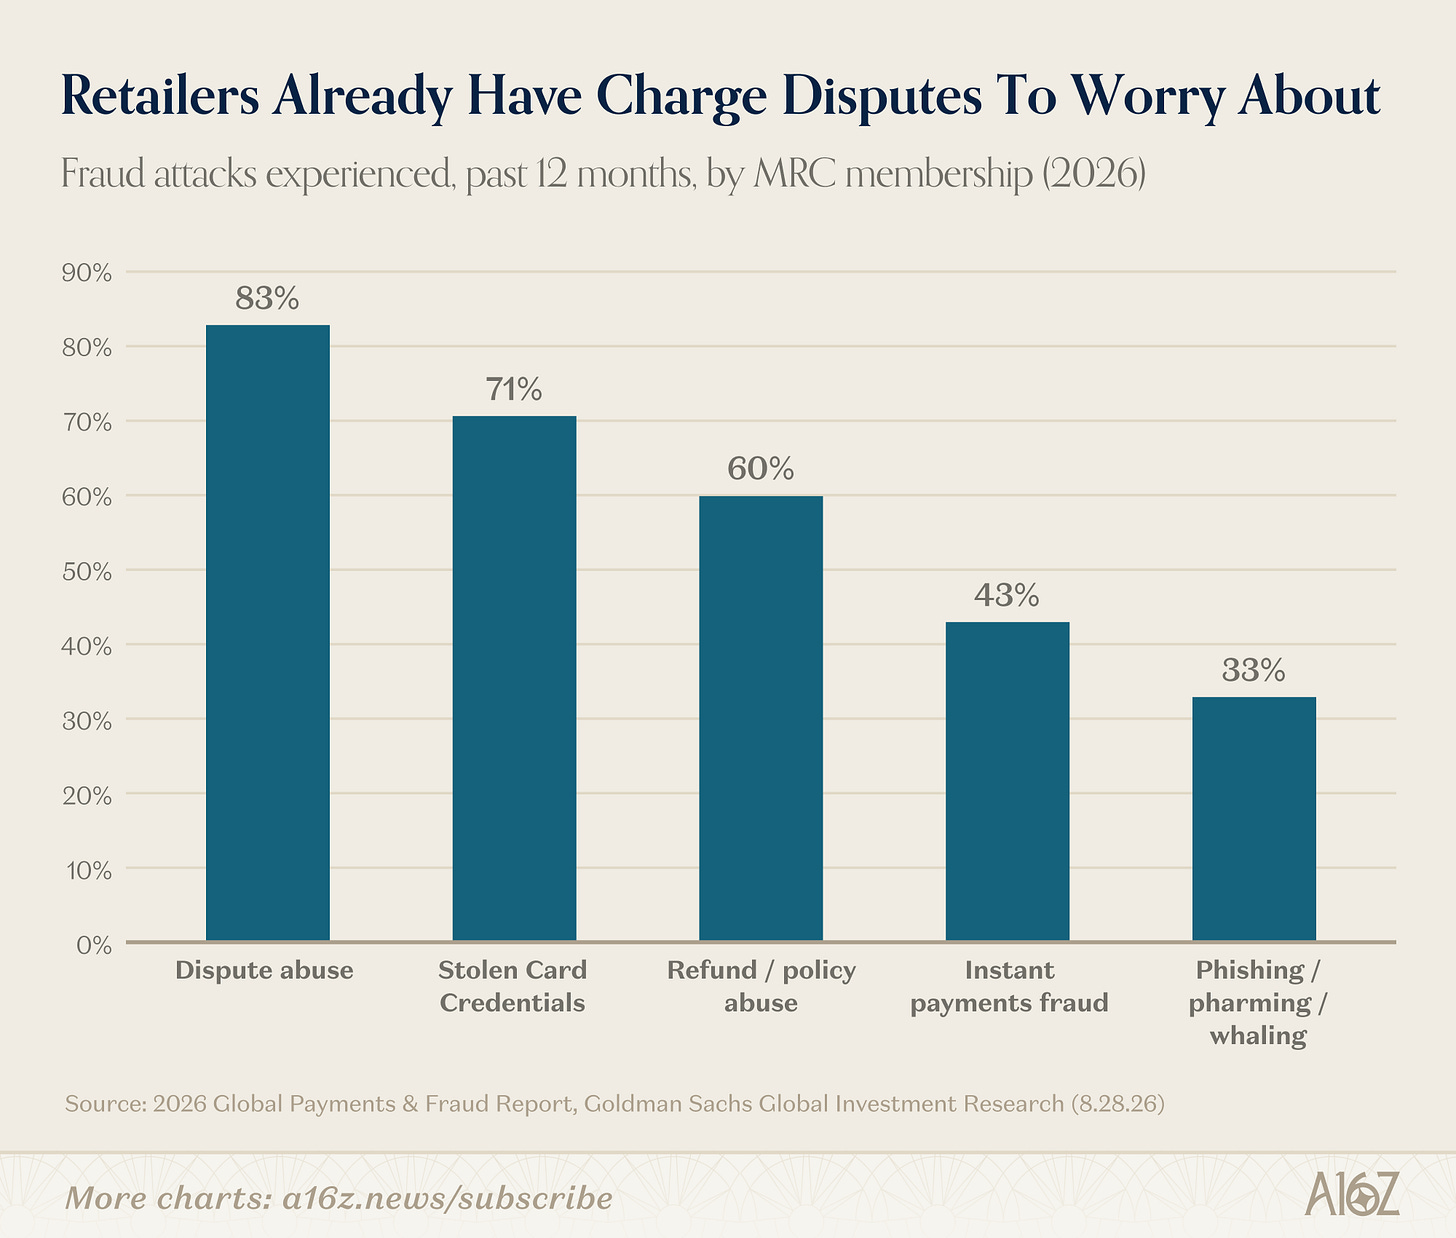
According to data from the NRF, return rates and the total cost of returns have basically doubled and tripled, respectively, since 2019. Likewise, reported fraud is pervasive, with the most common concern being “dispute abuse,” i.e. customers buying something and then later disputing the charge. If the card issuer takes the customer’s side, the merchant is SOL.
It’s not hard to understand why etailers would be concerned that agentic commerce could make a worsening problem even worse. “Oh, my agent bought that personalized varsity jacket with my name in sequins, not me, I’d never do that” or “I told my agent to buy socks at the best price, but I didn’t expect it would find the ‘10,000 pairs of argyles, wholesale special,’ so please send a return label and a forklift.”
OK, so fraud, returns, customer relationships, and ad monetization are all throwing sand in the gears of the agentic commerce wave, but presumably those are solvable problems with better tech and commercial ingenuity.
There’s another problem, however, that may be holding back the bot-buying-spree: it’s possible that consumers don’t actually want their bots to do their shopping for them (yet).
As of now (according to some data, at least), consumers seem broadly open to the idea of AI helping them find what they’re looking for, and especially helping them find the best price, but when it comes to actually making the purchase, consumers appear to be somewhat resistant:
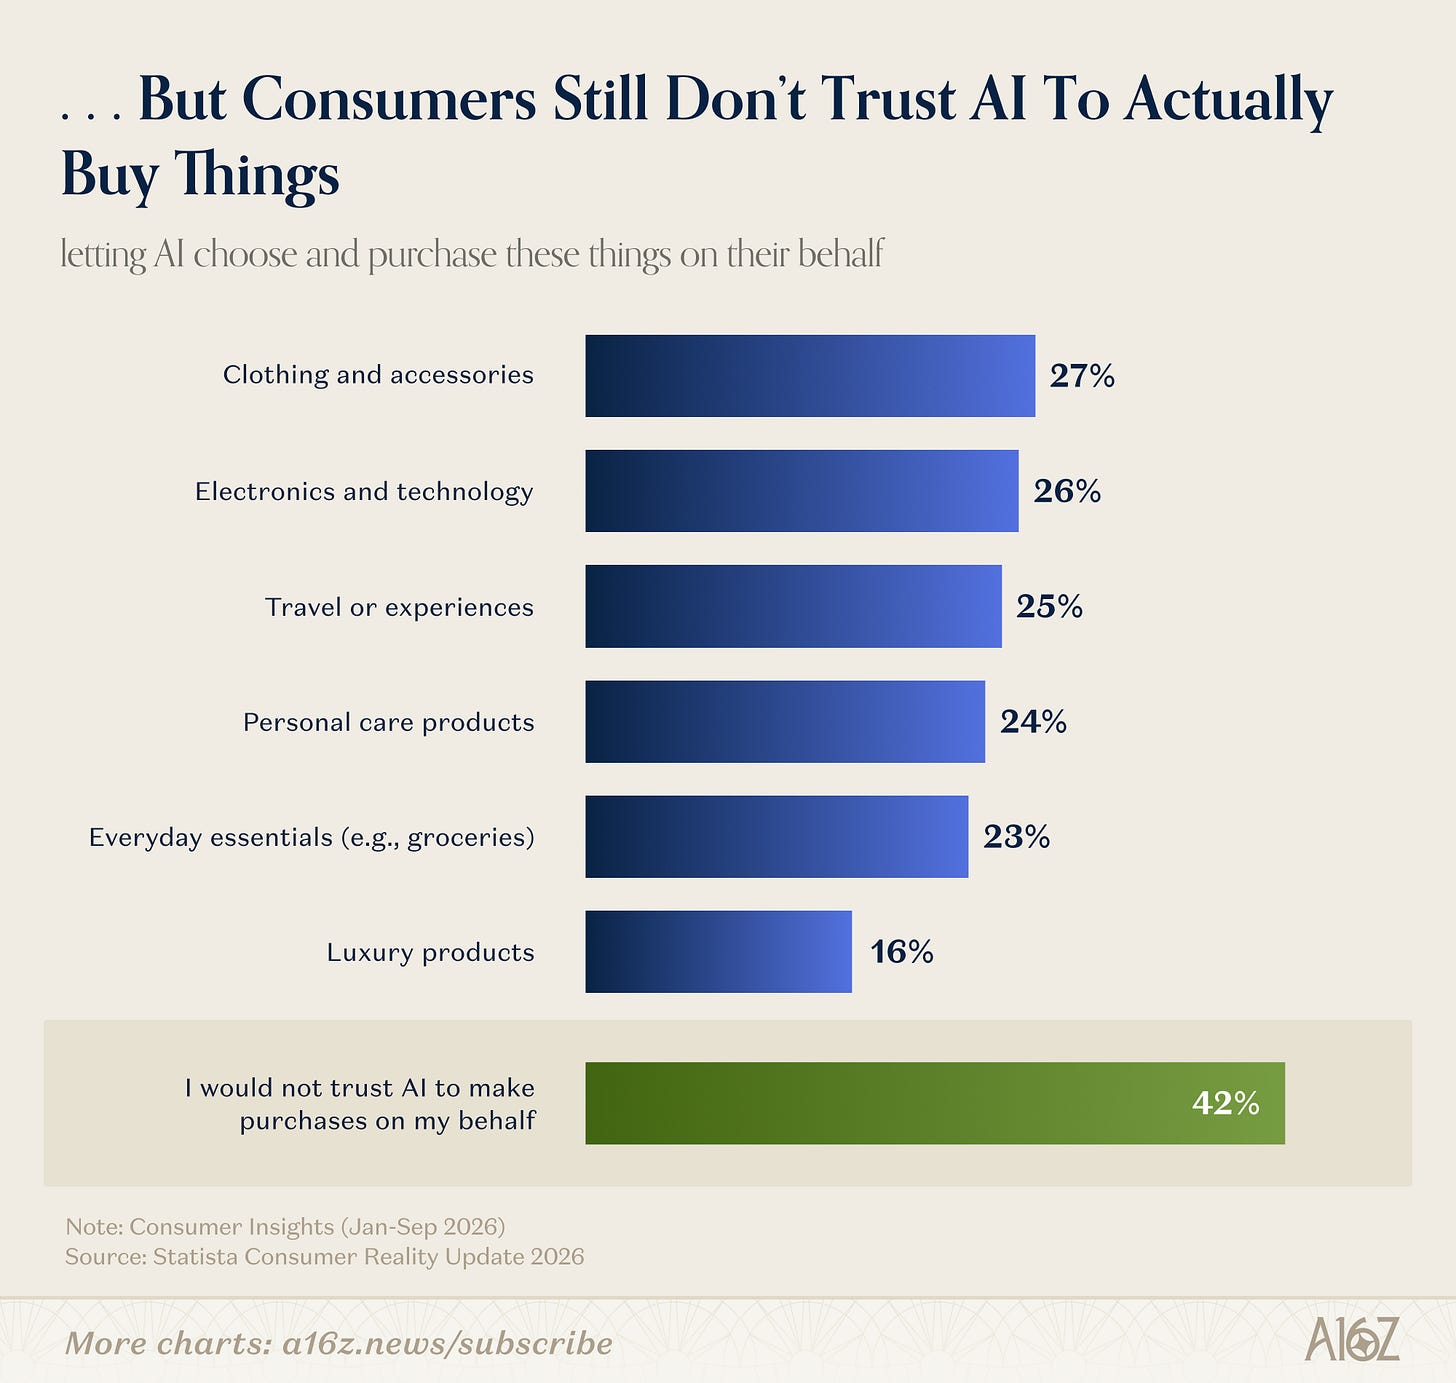
~25% of respondents said they’d be comfortable letting AI buy them a variety of consumer goods (except for luxury goods), but 42% said they would not trust AI at all to make purchases on their behalf. That’s less than half, but it’s still more than one would expect.
It would seem, that for now, consumers—like the etailers—are also worried about mistaken purchases, annoying returns, and chargeback disputes. That, and it may be the case that people just like to do their own shopping, at least when it comes to the final purchase decision.
Along those lines, there is some clickstream data from Similarweb (albeit a little stale) that seems to bear that out: AI is good for a consult, but buying is (for now) a human affair. There appears to be an increasing share of “shopping journeys” that visit AI before hitting the actual checkout page, but really the vast majority of AI shopping sessions appear to be in the “middle phase” of the journey, i.e. between discovery and purchase:
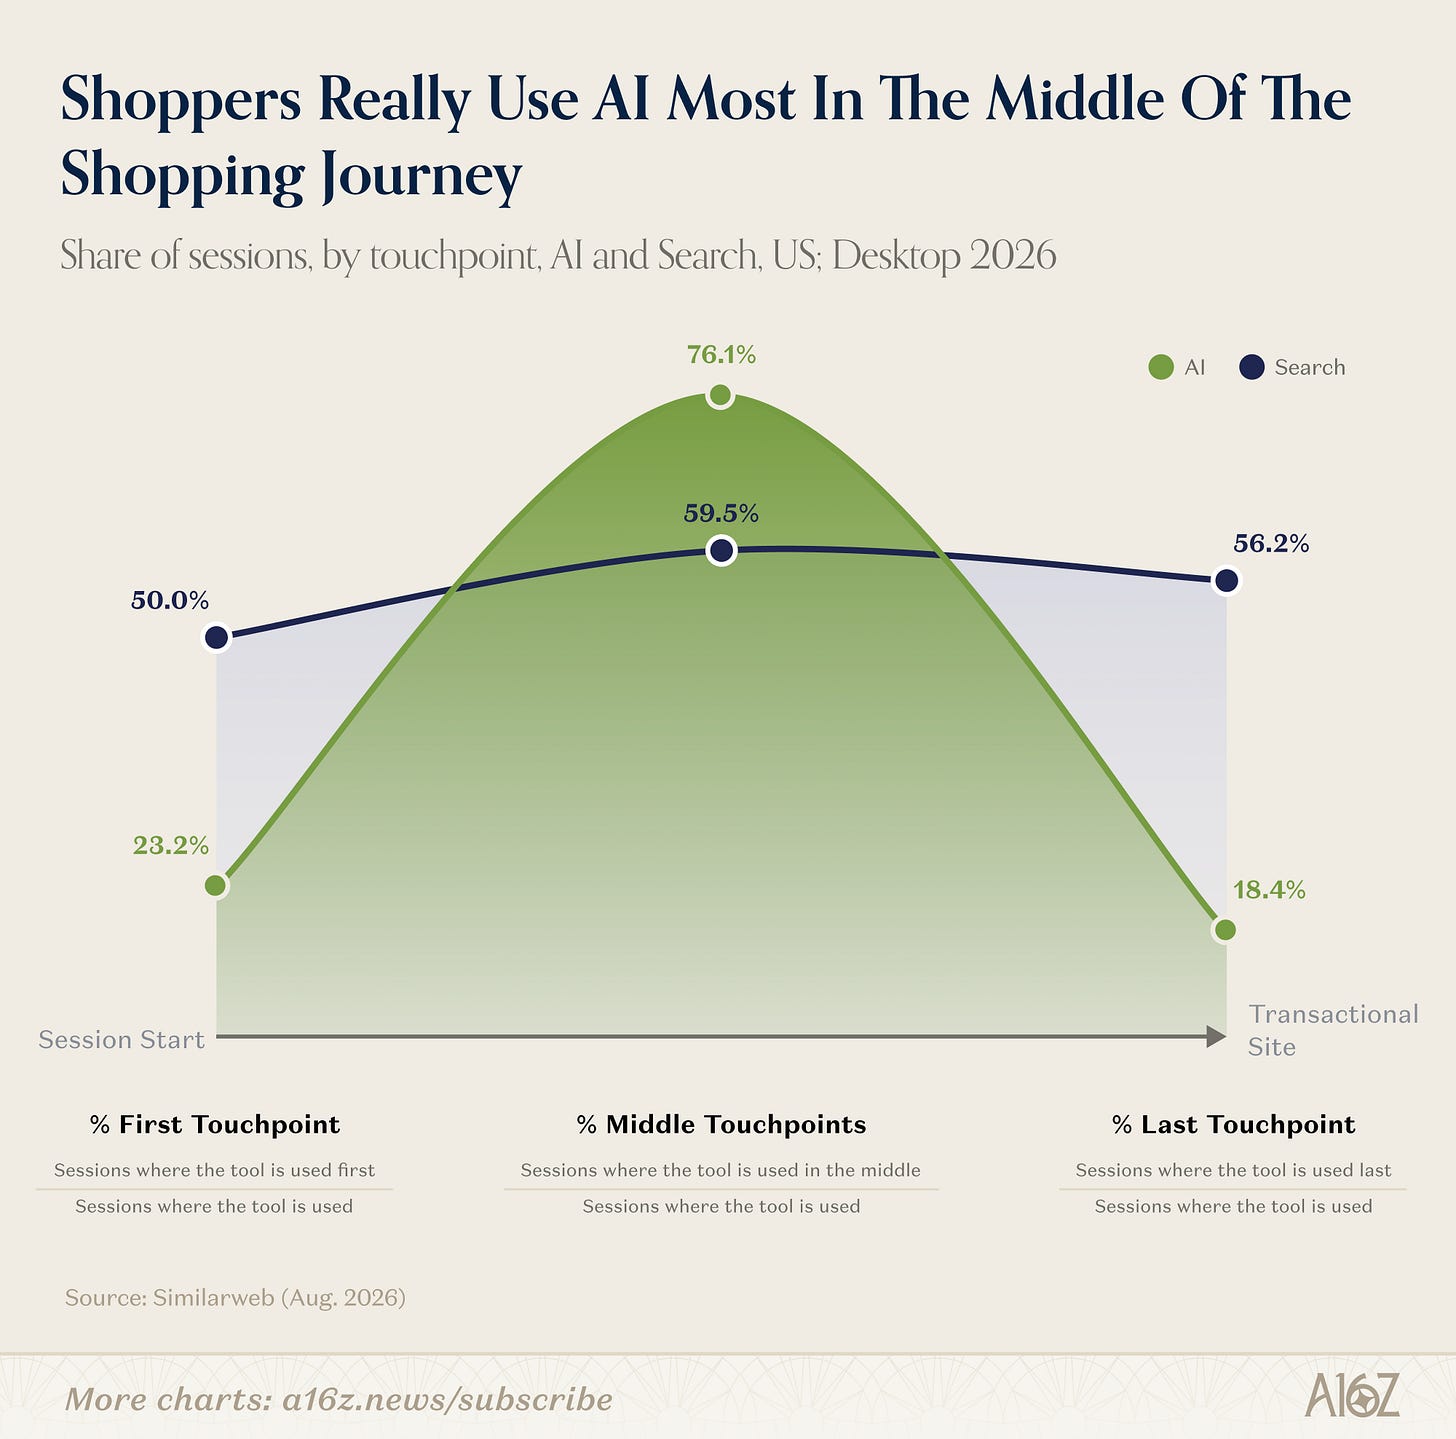
It’s fair to take this data with a grain of salt (because that is the nature of clickstream data), but the implications are otherwise pretty clear: for now, consumers seem to be using AI predominantly to do their homework on products they’ve already discovered, rather than either (a) discovering them with AI or (b) using AI to make the final purchase decision.
That makes the case for agentic commerce a bit less straightforward, but it especially makes the question of AI advertising attribution even less straightforward. If someone sees a recommendation in their AI-led middle shopping journey, but then makes the final purchase decision in a different session, then who will know what moved the consumer spirit to which outcome and when?
Again, the data appears to end in June, so whether that’s still true, let alone will remain true, is an open question, but either way, the relationship between shopper and bot is more complicated than it seems.
While on the subject of ecomm, and potential disruption (or not) from agentic commerce, it turns out that social commerce on TikTok Shop has an incredible right-tail skew, for both the social part and the commerce part.
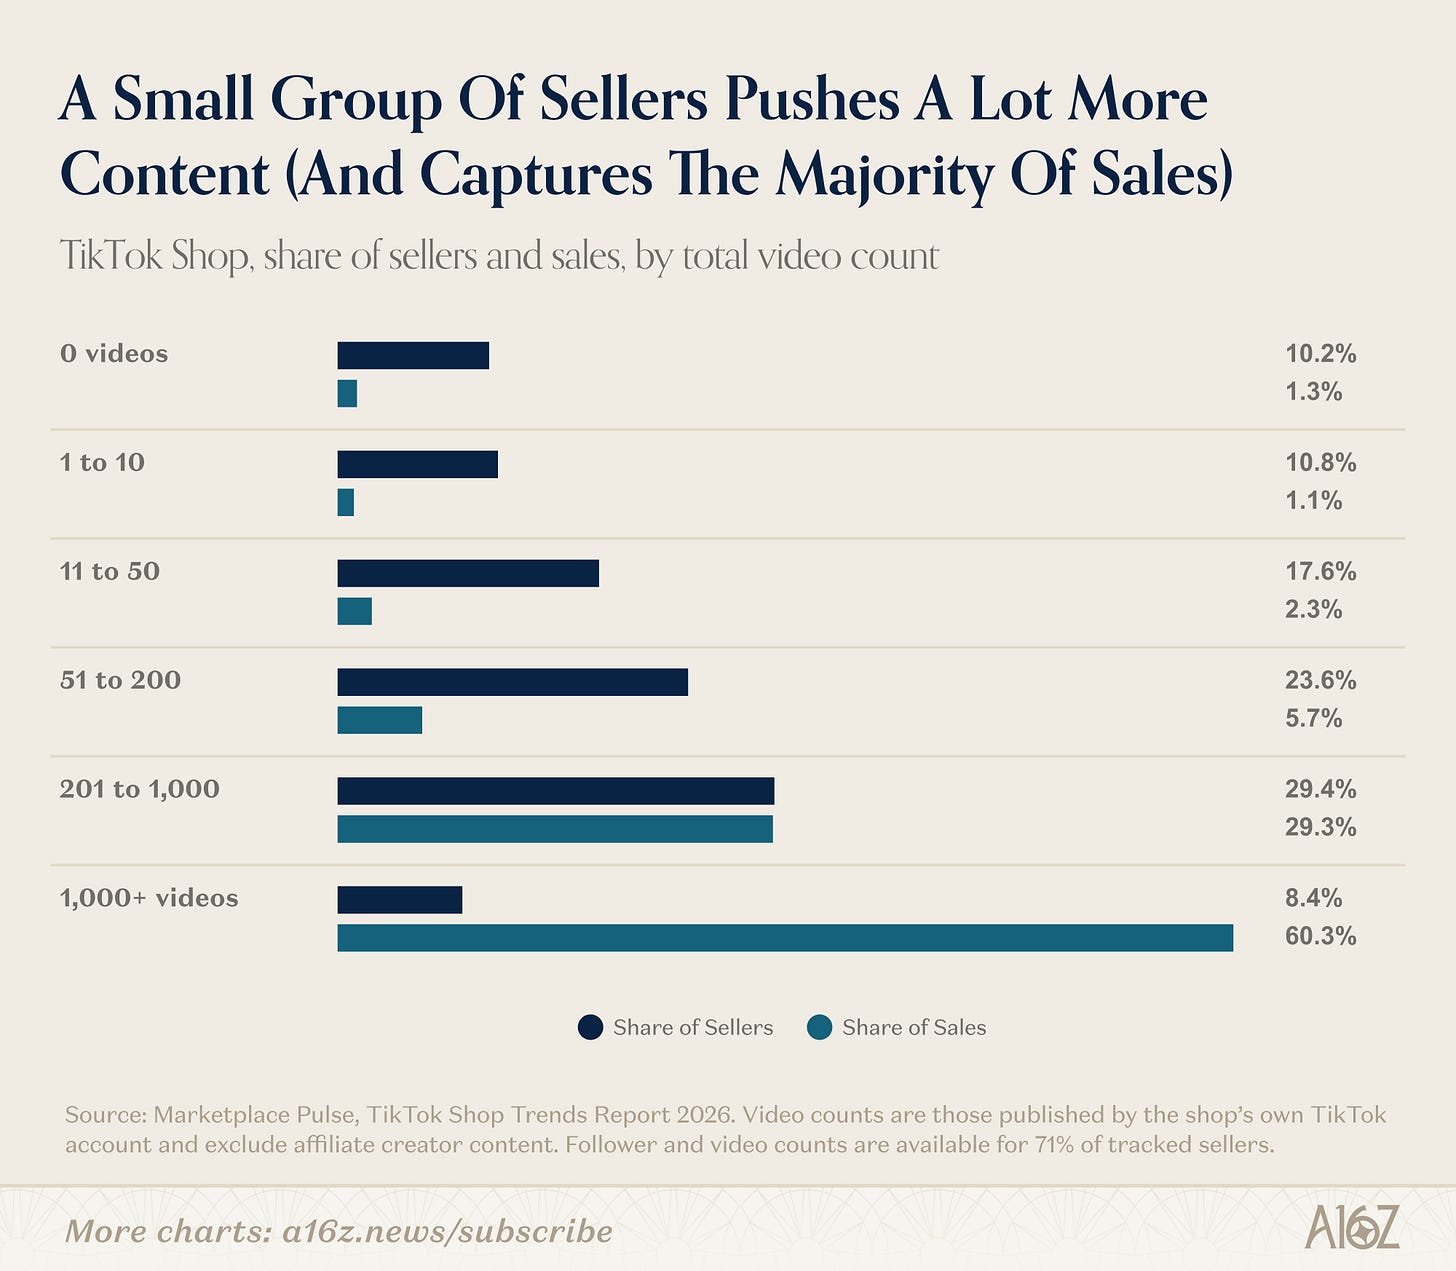
According to data from Marketplace Pulse, 8.4% of TikTok Shop sellers generate 1,000+ videos and capture ~60% of overall sales. Make a lot more videos, sell a lot more stuff.
But the distribution of sales to sellers is actually even more extreme.
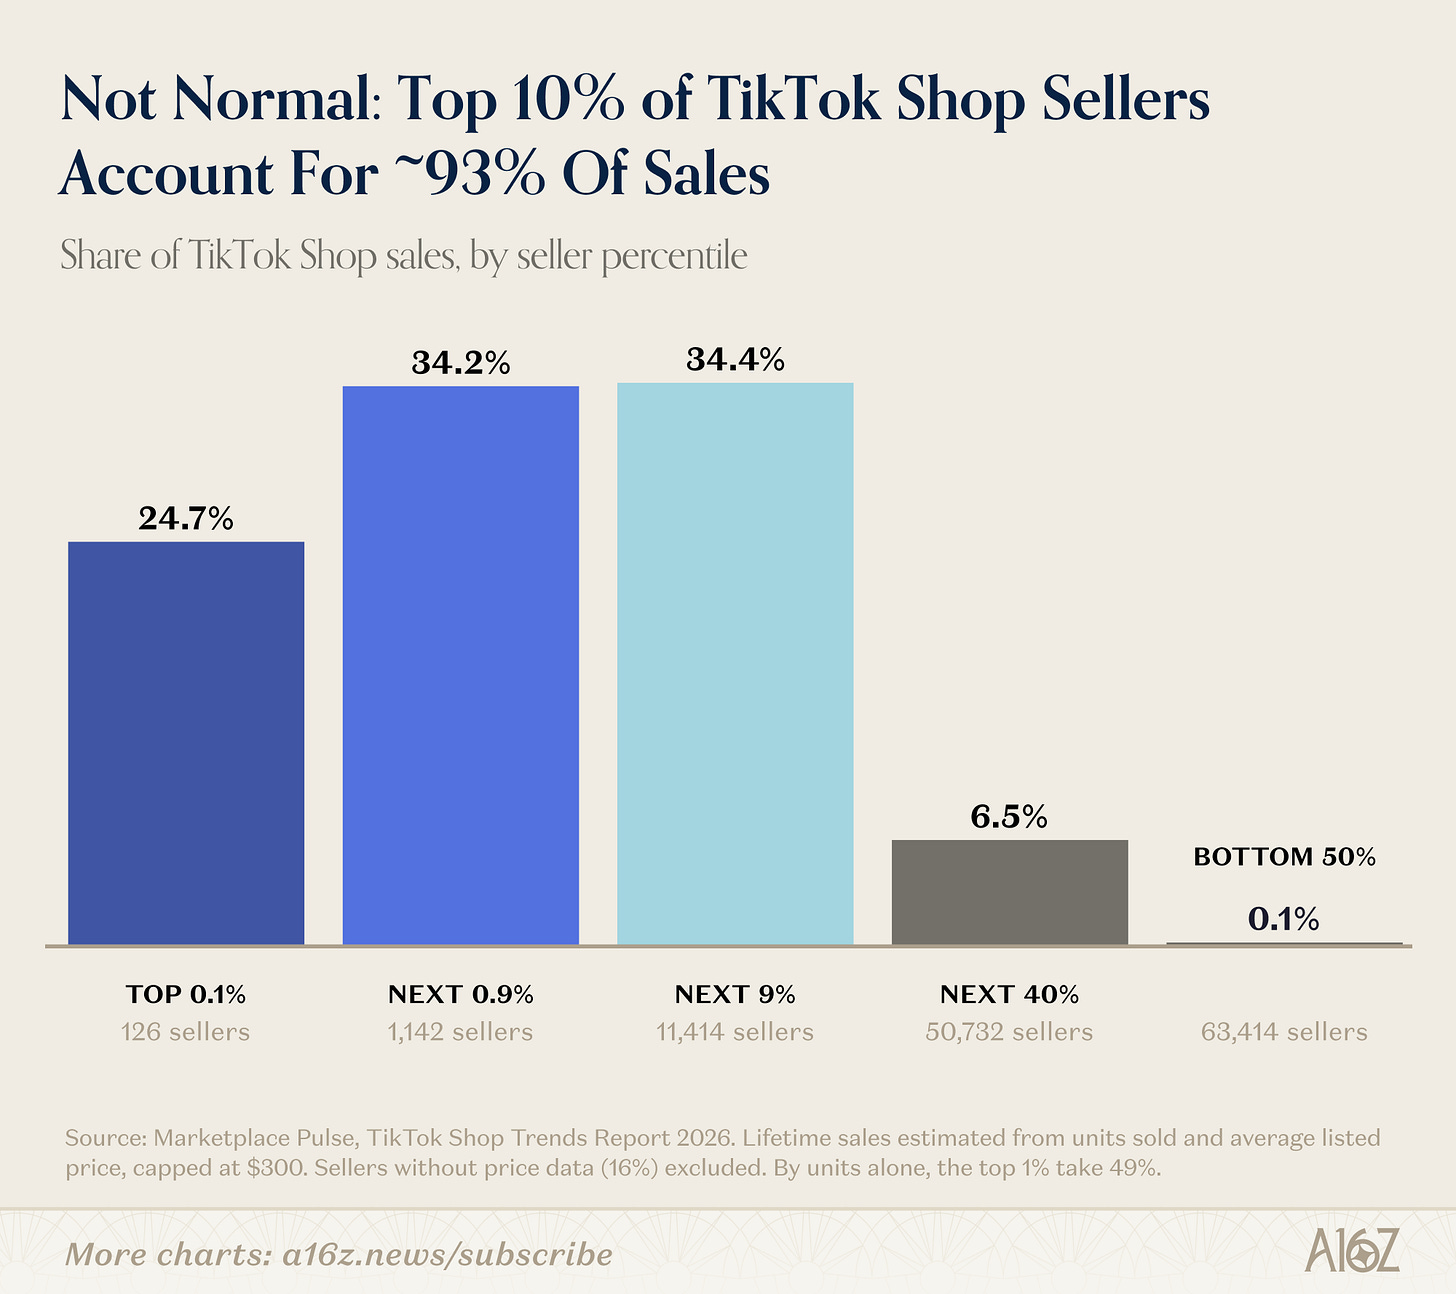
Again, according to Marketplace Pulse, ~60% of sales are driven by the top 1% of sellers, and ~93% of sales are driven by the top 10%.
It’s hard to know what to make of this really, other than simply to marvel at the persistence of (super) pareto distributions, but Charts will try to, anyway.
- On the one hand, it seems that making a lot a lot of videos is a good way to drive sales, which implies there’s something evidently “personal” about the shopping experience that would be hard for an agent to replicate (although perhaps if Muse live-streamed its journey, that could change).
- On the other hand, if agentic commerce really does take off, then what would it mean for this small, but mighty cohort of prolific content creators who drive sales through a medium that has no relevance to an agent whatsoever?
Of course, agentic commerce and social commerce do not have to be mutually exclusive. Retail is really big, and there’s plenty of room for more than one model. But, it does seem broadly true that the way we shop now is optimized for a human interface to a degree that “just add agents” may be underestimating.
Charts has no intention of weighing in one way or another on the “inflation: will it, won’t it” debate, but it will take a moment to reflect on the old saying that “the cure to high prices is high prices,” because it certainly seems worthy of some consideration.
The basic premise is straightforward: if prices get high enough, they suppress demand—either for that thing, or some other thing(s) that demand can no longer afford because demand is paying so much for the now more expensive thing. As everyone knows, when demand falls, prices tend to follow . . . so if high prices eventually suppress demand, and suppressed demand leads to falling prices, then the cure to high prices is . . . high prices.
Simple enough.
In this case, most everyone knows by now that AI capex has led to a surge in demand for chips and electrical components that is causing the price of those components to rise substantially:
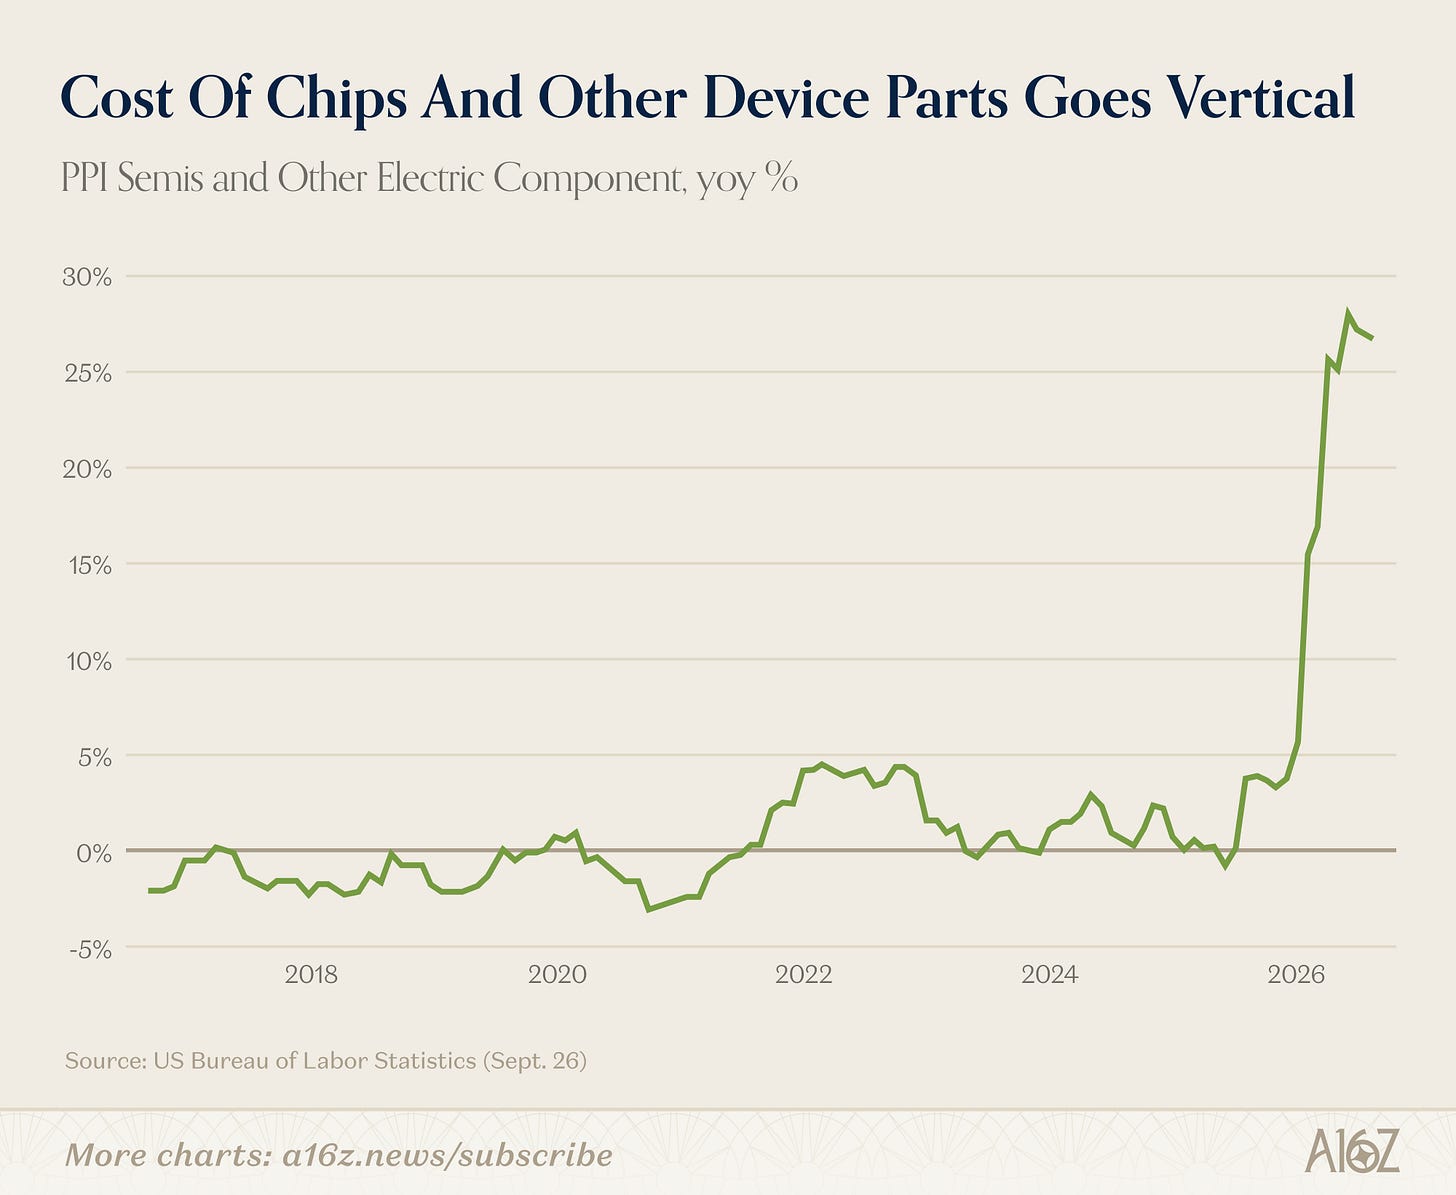
According to the BLS, the prices paid for semis etc., by manufacturers of computers and computer-like things have skyrocketed over 25% YoY.
Now, those high prices do not appear to be dampening hyperscaler demand for chips—if anything, capex forecasts have gone higher, in part because the components have gotten more expensive.
But that doesn’t mean high prices are having no effect on demand. Hyperscalers may still be on a chip-buying spree, but everyone else appears to be saving their hardware upgrades for another day:
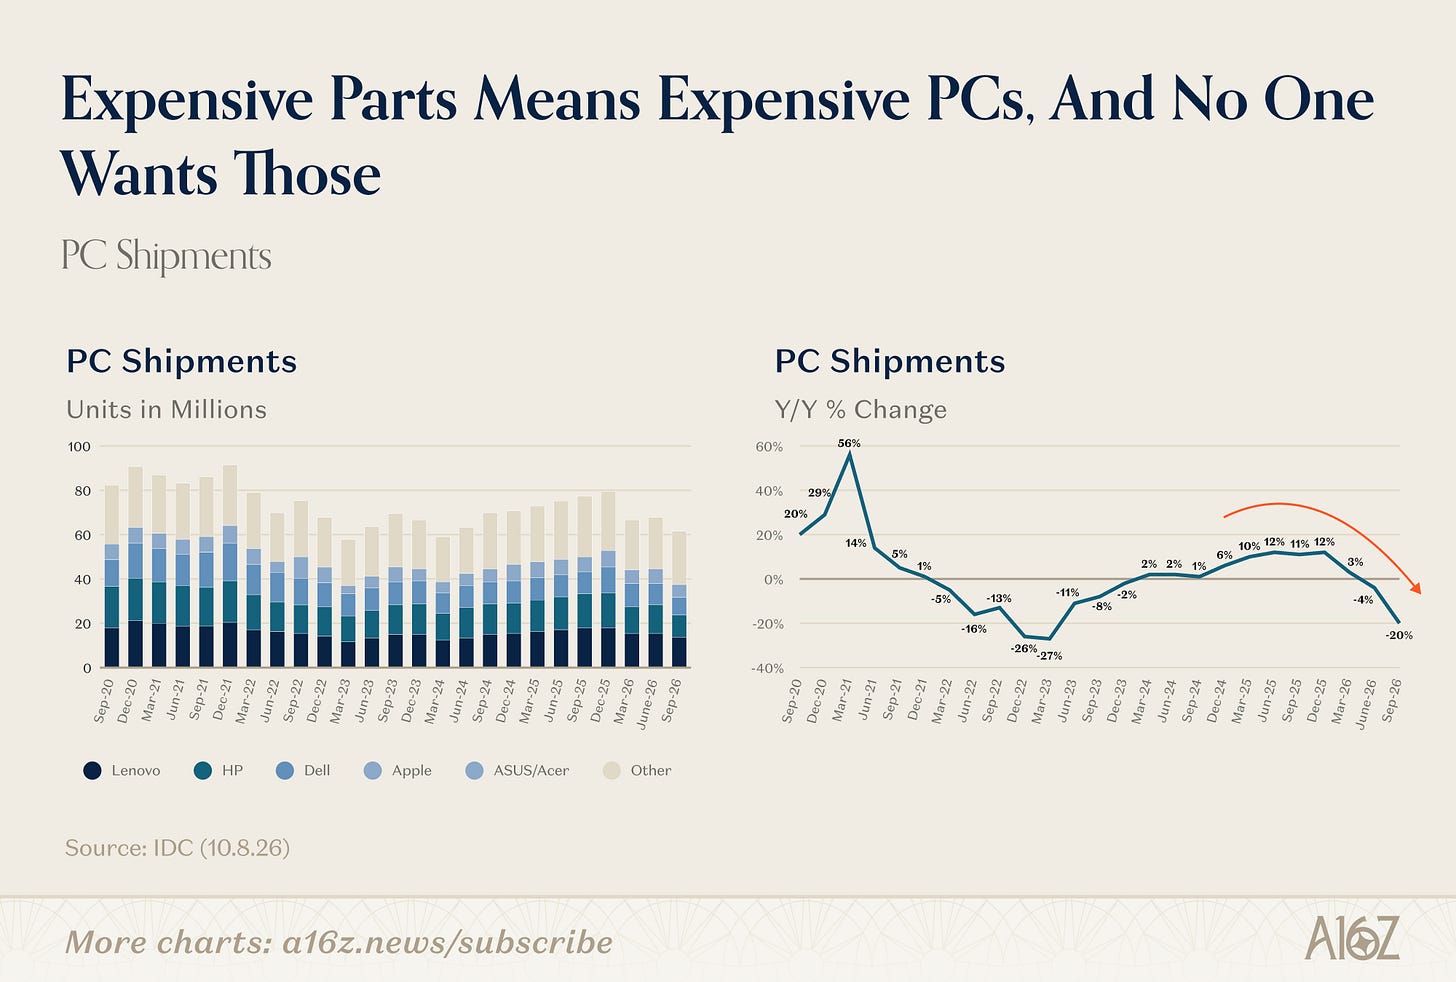
Just taking PCs as an example, according to IDC, PC shipments have dropped substantially since the beginning of the year.
It’s not just PCs that are facing some demand headwinds, but iPhones, as well, all of which have gotten more expensive, partly as a result of the AI buildout. Now, is it definitely the case that high prices are the reason that fewer PCs and iPhones are shipping? No, but it seems like a pretty good guess. And if that’s true, then the old adage appears to be working its way through the system (and will perhaps be reflected in softer prices, soon enough).
Consider, perhaps, another example of high prices being the cure to high prices.
Many, including the State of Markets, have observed the rising prominence of debt, when it comes to financing the buildout. Increased demand for borrowing (among other things) has, unsurprisingly, led to rising prices on that debt:
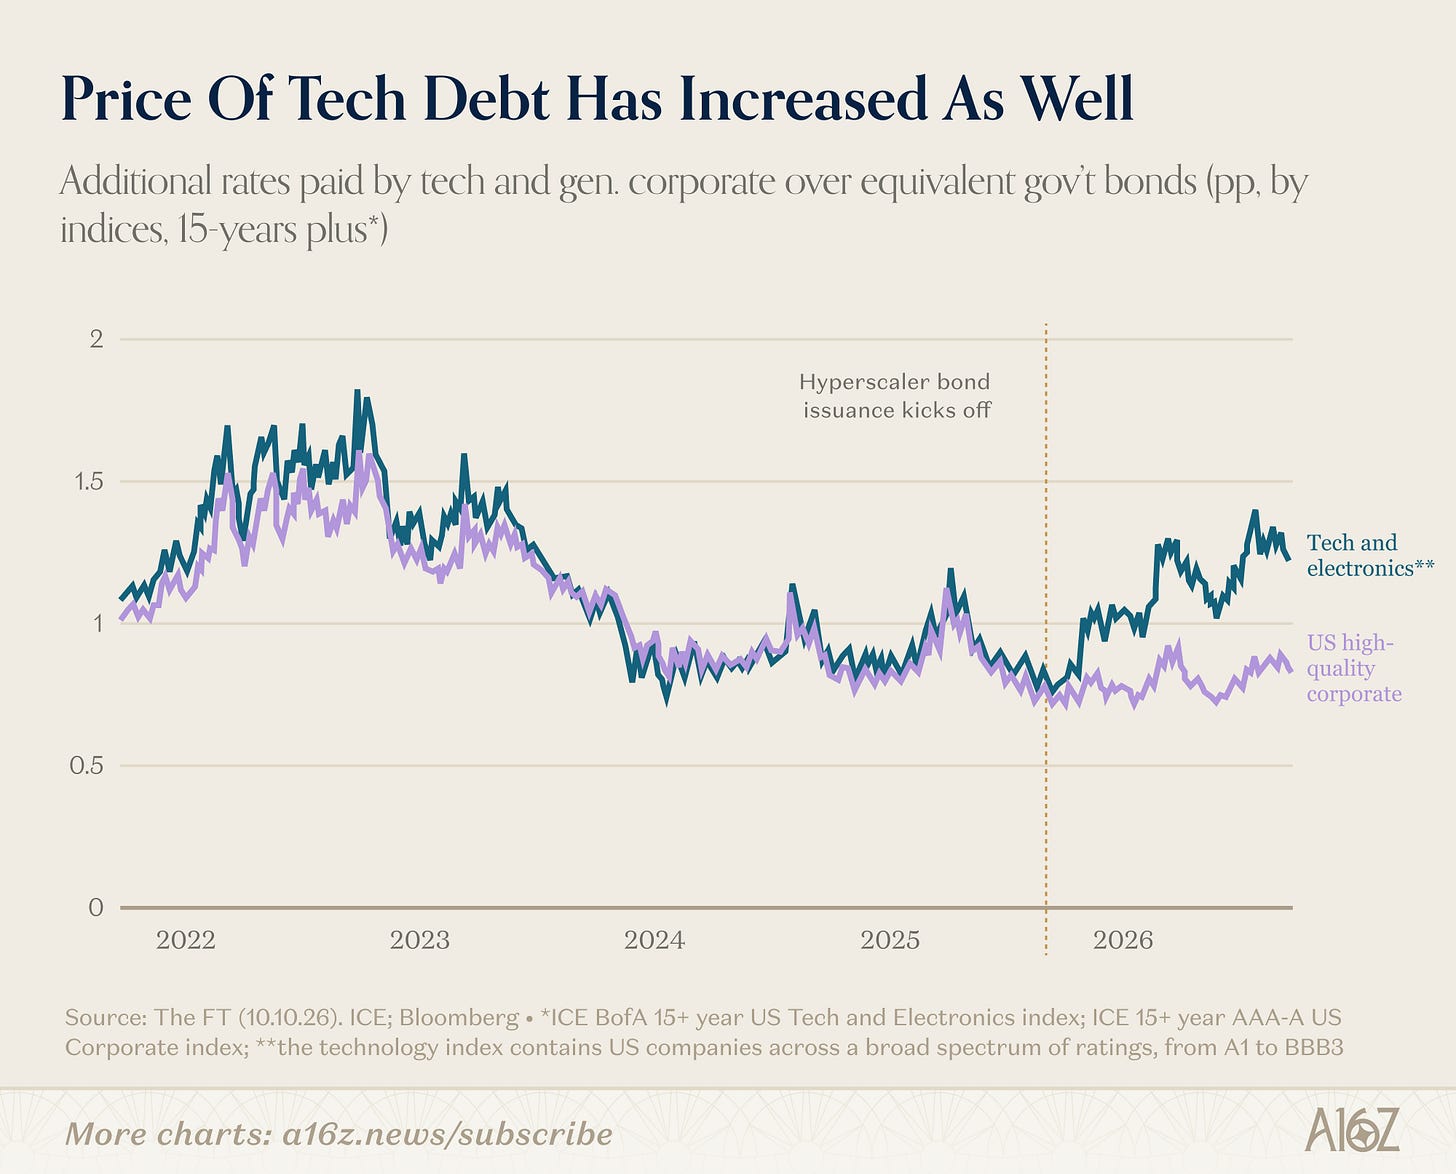
Rates for bonds linked to the tech sector have meaningfully diverged from the broader universe of corporate issuance, beginning roughly in September of ‘25, when capex borrowing began to take off.
More demand generally means higher prices, so it all checks out. And if higher prices eventually mean less demand, well, that too also appears to check out:
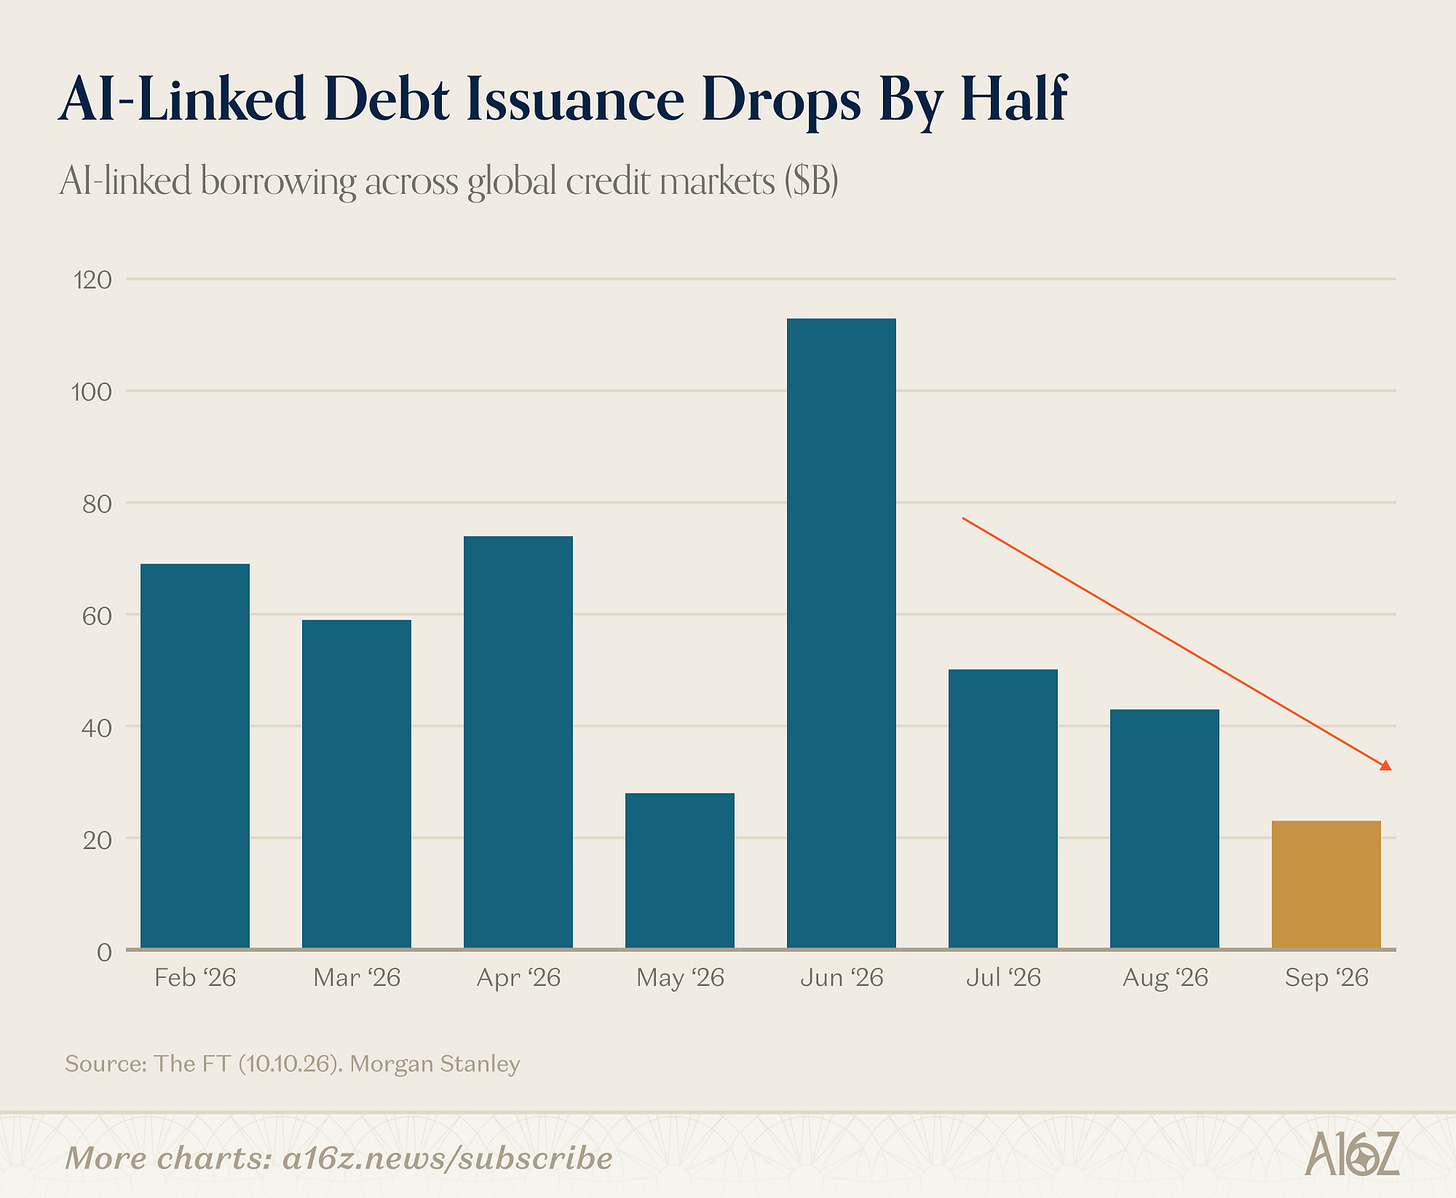
After growing substantially throughout the first half of the year, AI-linked debt issuance has fallen off since its June peak, with September issuance checking in at barely half of what was issued in August (which was already less than what was issued in July).
Of course, there are other reasons beyond supply and demand that would cause debt pricing to rise and fall, but supply and demand surely matter. And in this case, it appears as though the high price of borrowing has indeed put a damper on the inclination to borrow.
If demand falls, does that mean the cost of borrowing will fall in turn, and score another win for the old saying? We don’t know yet, but we’ll probably know soon enough.
How’s this for a narrative violation?
According to some data and analysis from PNC Bank, Zoomers are actually doing pretty well, from a financial standpoint. Not only are they doing well, but Gen Z is doing considerably better in 2025 than Millennials were doing 10 years ago (when Millennials were Zoomer-aged):
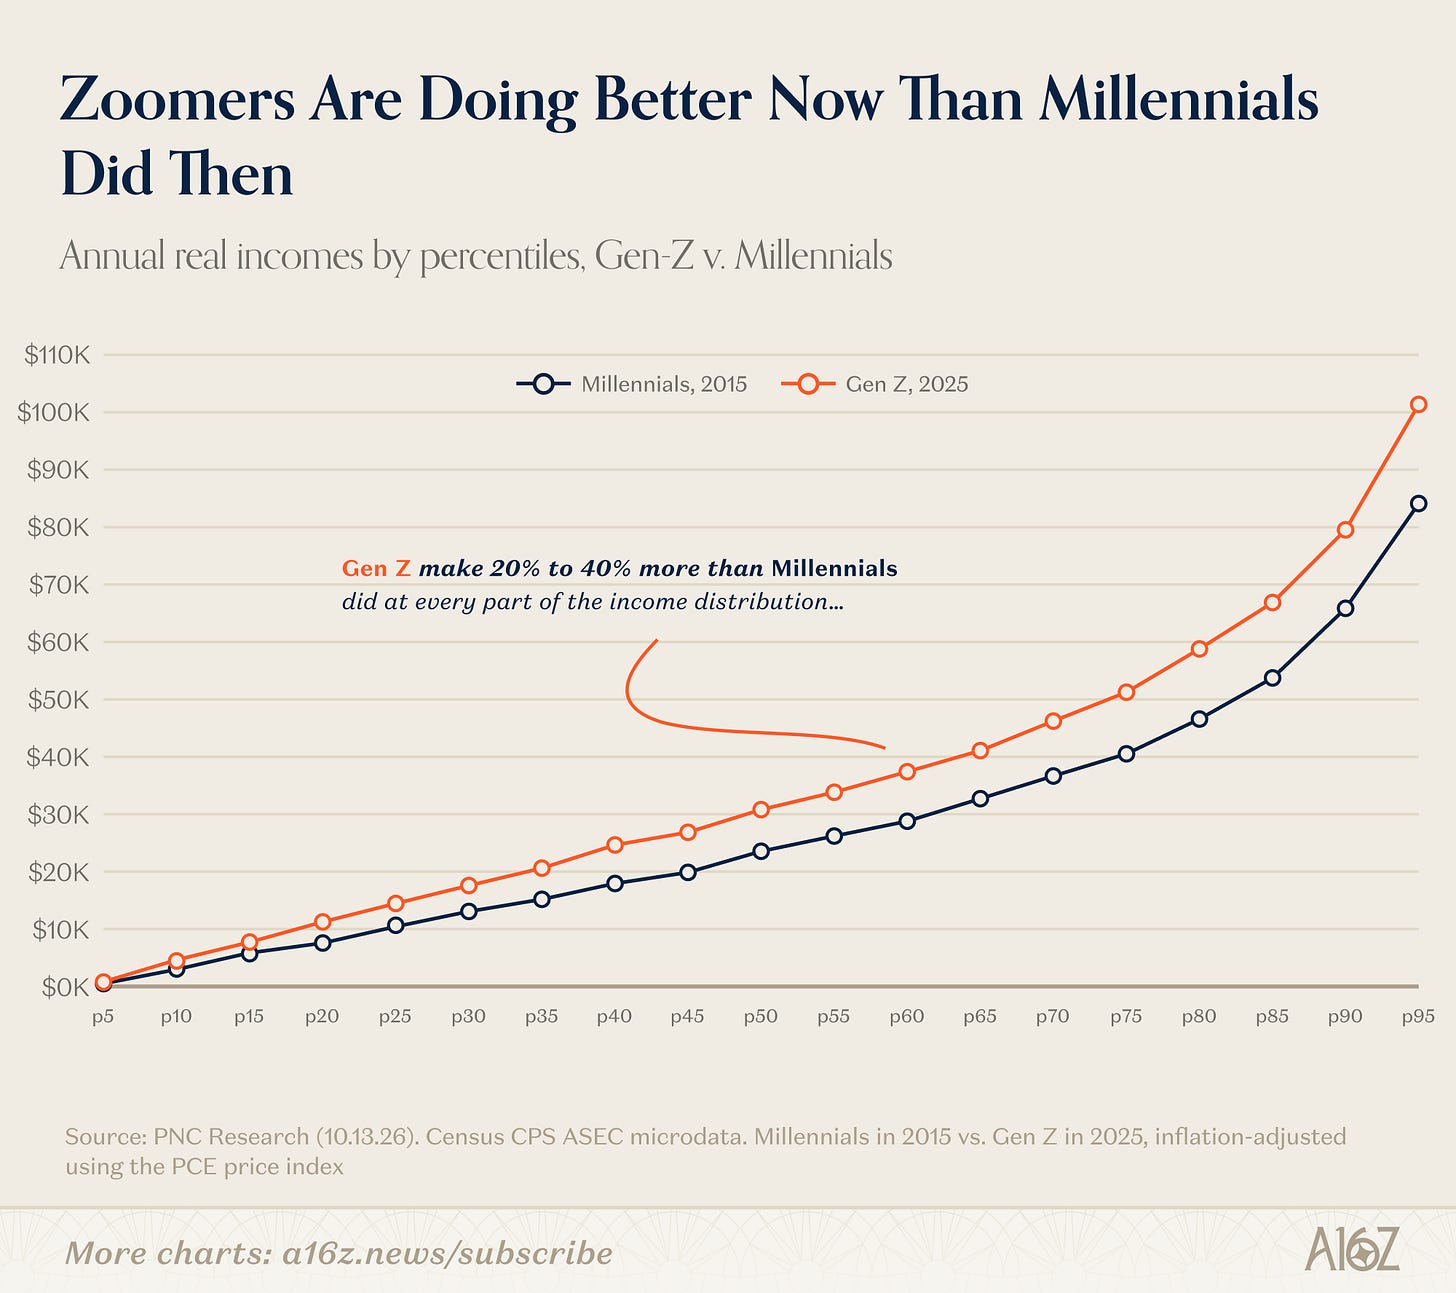
Zoomers enjoy real incomes that are 20-40% higher than what their Millennial elders suffered at every part of the income distribution. Point-in-time generational comps are imperfect, but it’s still not the result most would expect to find.
It’s also not just higher incomes where Zoomers are winning. There’s also data that suggests Zoomers face lower unemployment, have higher net worths, more liquid assets, and bigger retirement accounts, then the previous generation did at an equivalent stage of life.
Indeed, with all that extra cheddar, it would appear as though Zoomers are living relatively large:
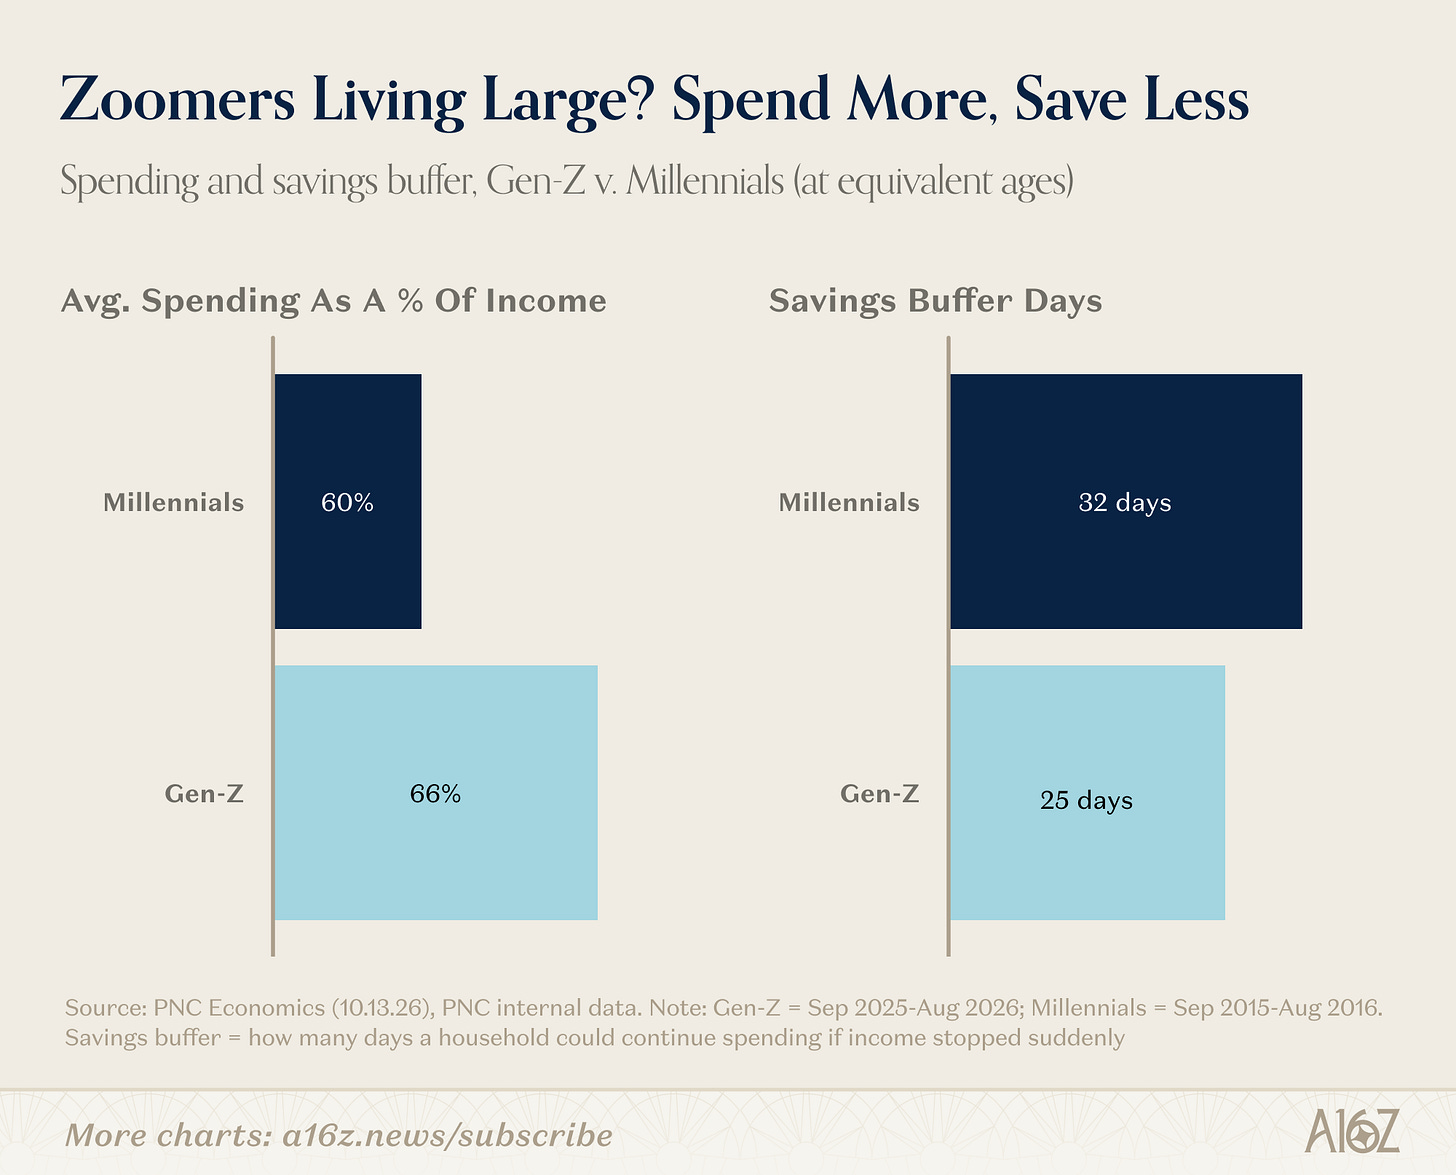
According to PNC’s internal data, Zoomers spend more of their income than Millennials and leave less in the rainy-day fund, as well.
In terms of what Zoomers are spending their money on, they allocate more to retirement, shelter, and transportation, and substantially less to education and energy:
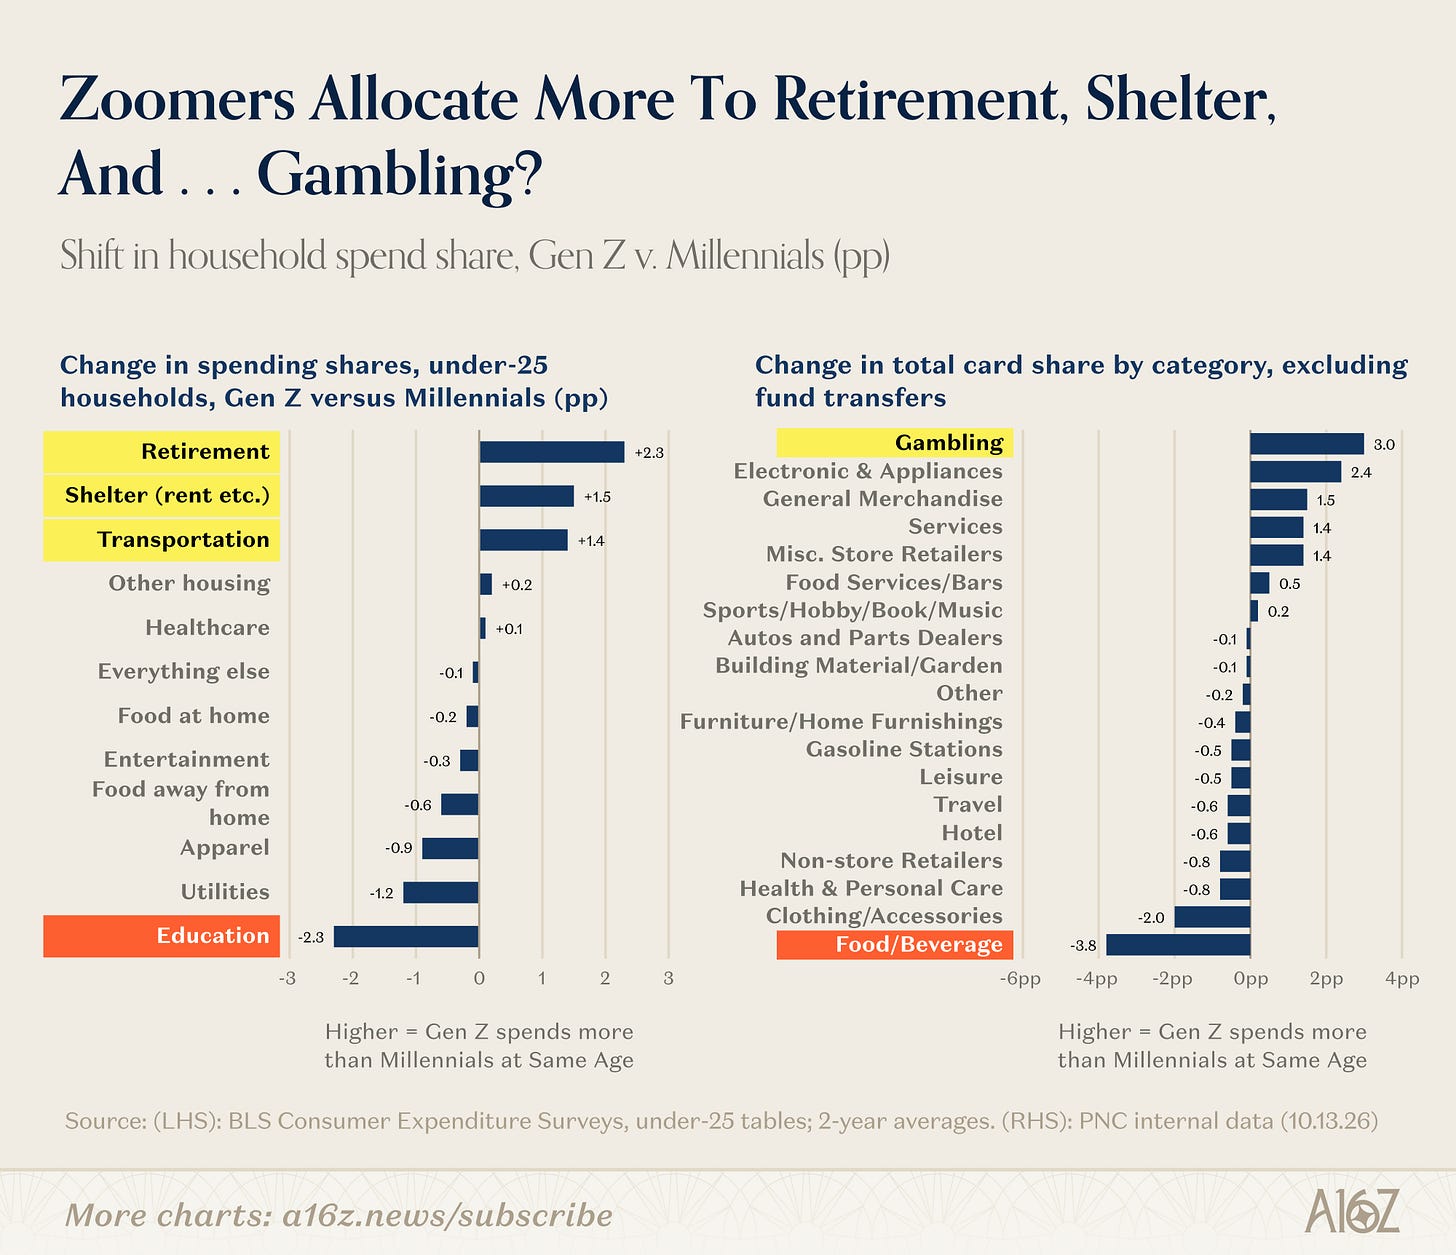
At the category level, Zoomers also allocate relatively more to gambling and devices, but relatively less to clothing and sustenance.
Save more for retirement (but keep less in the rainy-day fund), while also hitting the tables and the money line, but sparing the booze. It’s an odd combination, but it’s Zoomer money, and they can spend it how they please.
Well, perhaps, “please” is the wrong word, because whatever their material advantages over generations prior, the Zoomer mood is decidedly dour:
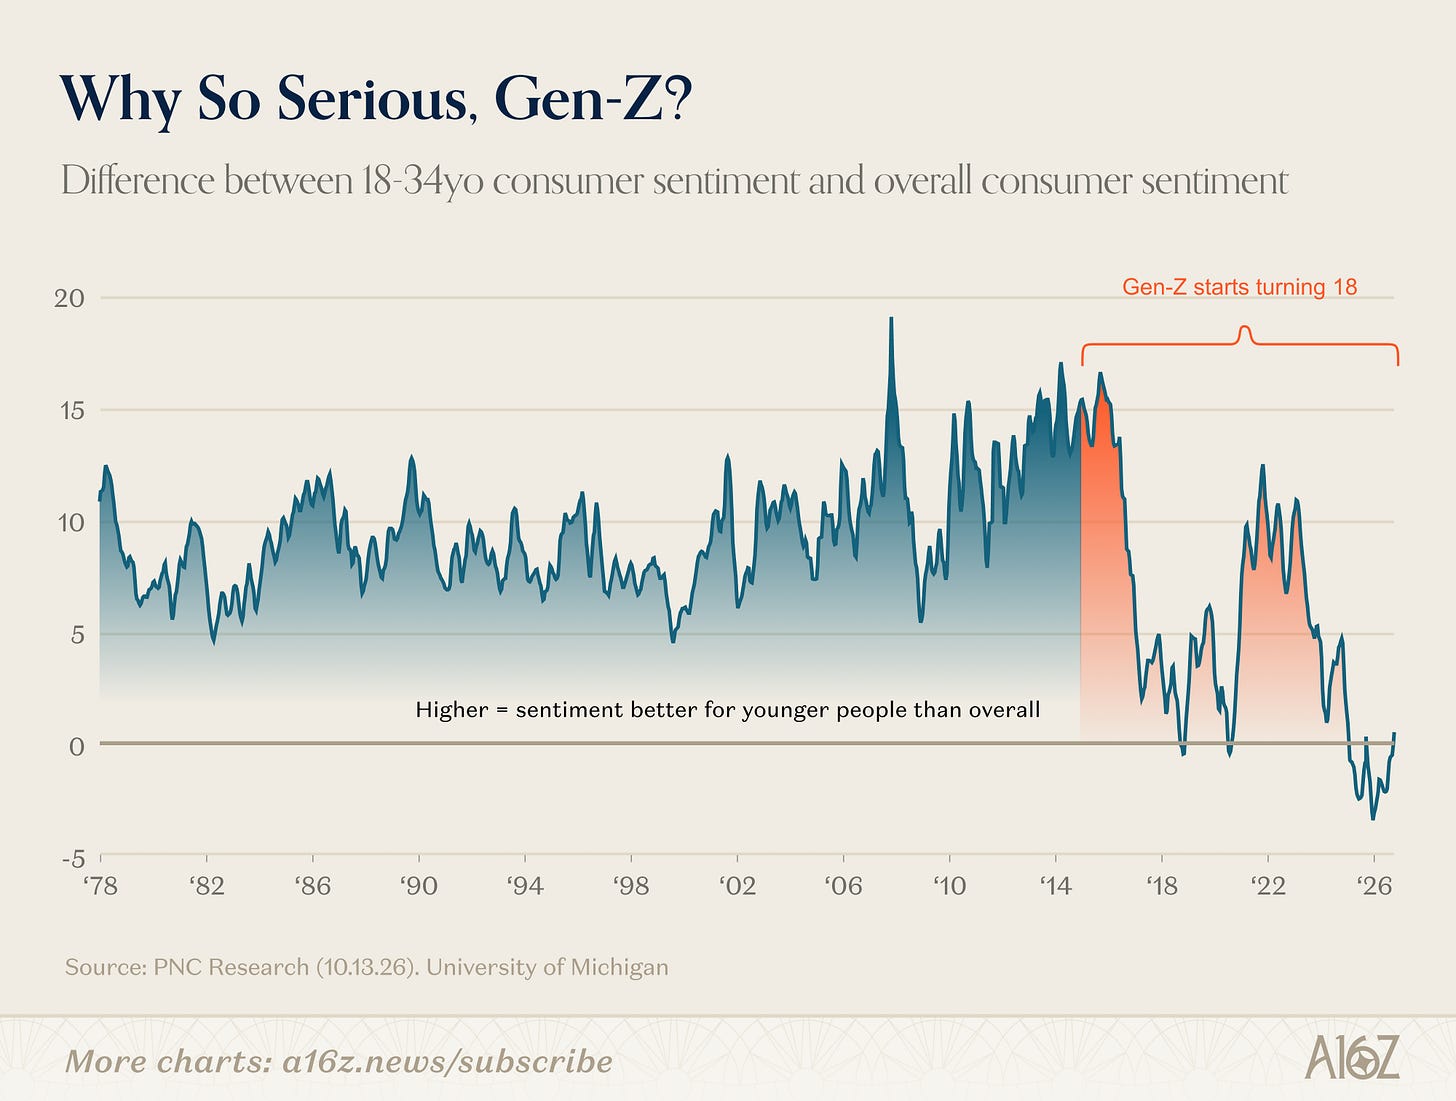
Since 2017 (with a partial reprieve during pandemania), the traditional “sentiment” advantage that 18-34 year-olds typically enjoy relative to the broader population has all but evaporated. The Zoomers are not as cheerful as young folks of yore.
Now, consumer confidence is a very noisy series that has lost even more signal since the pandemic, likely because of falling response rates (among other things), but even if it’s noisier, it’s strange (but possible) that the noise would be isolated to 18-34 year-olds. In other words, even if the headline “confidence” figure is less reliable, one would think the ratios within ought to stay relatively stable . . . and in this case, it appears they haven’t: Zoomers are no more confident than anyone else, which makes them unlike all the young people of generations prior (at least through the ‘70s).
Taking this at face value, it would appear that the data does validate the vibe . . . but however bad the vibes may be, it’s hard to blame finances. That doesn’t mean Zoomers are without other reasons to feel relatively less optimistic, but certainly when it comes to making and spending money, they seem to be doing just fine.
Why so serious, Young Zoomer?

This newsletter is provided for informational purposes only, and should not be relied upon as legal, business, investment, or tax advice. Furthermore, this content is not investment advice, nor is it intended for use by any investors or prospective investors in any a16z funds. This newsletter may link to other websites or contain other information obtained from third-party sources - a16z has not independently verified nor makes any representations about the current or enduring accuracy of such information. If this content includes third-party advertisements, a16z has not reviewed such advertisements and does not endorse any advertising content or related companies contained therein. Any investments or portfolio companies mentioned, referred to, or described are not representative of all investments in vehicles managed by a16z; visit https://a16z.com/investment-list/ for a full list of investments. Other important information can be found at a16z.com/disclosures. You’re receiving this newsletter since you opted in earlier; if you would like to opt out of future newsletters you may unsubscribe immediately.
No posts